

Understanding the sequence specificity of tRNA binding to elongation factor Tu using tRNA mutagenesis
- PMID: 19452597
- PMCID: PMC2779119
- DOI: 10.1016/j.jmb.2009.01.021
Understanding the sequence specificity of tRNA binding to elongation factor Tu using tRNA mutagenesis
Abstract
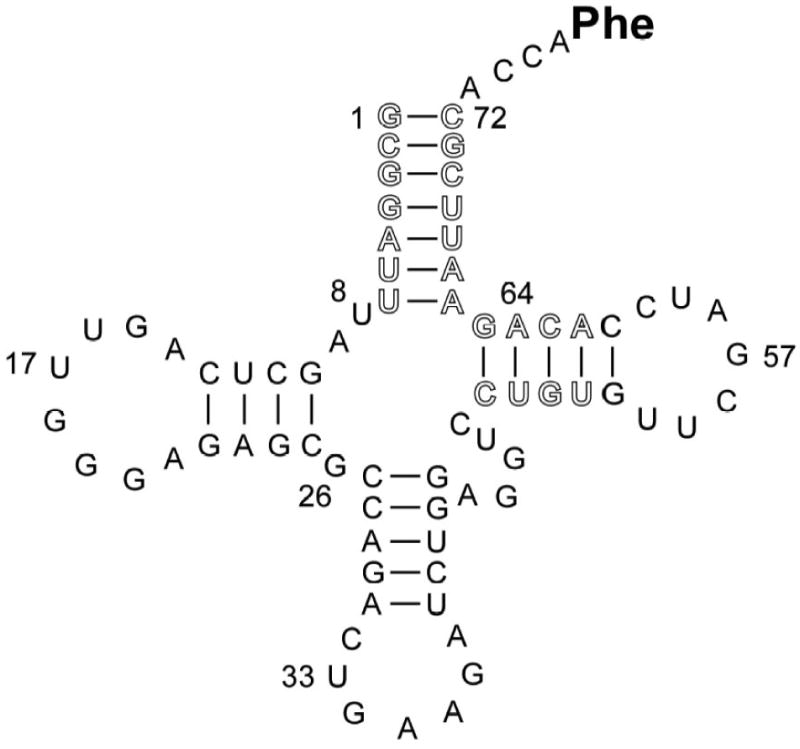
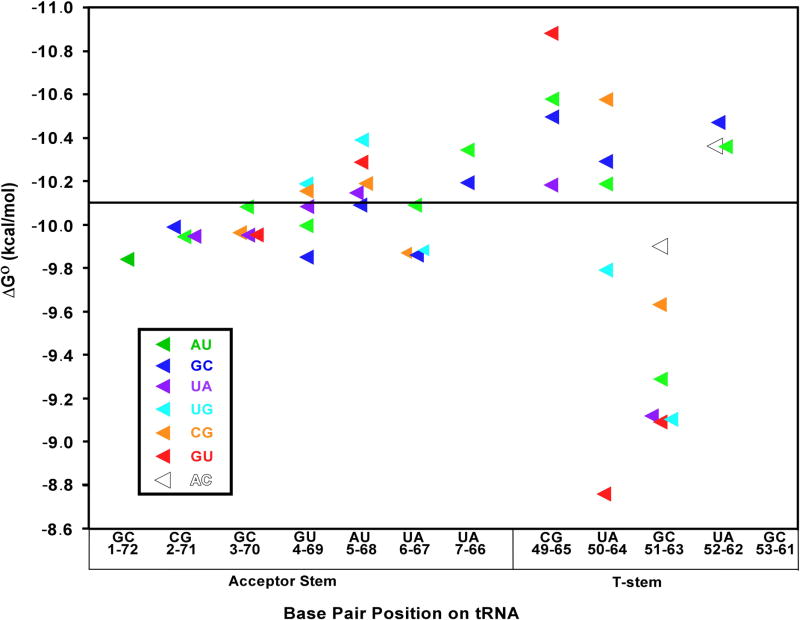
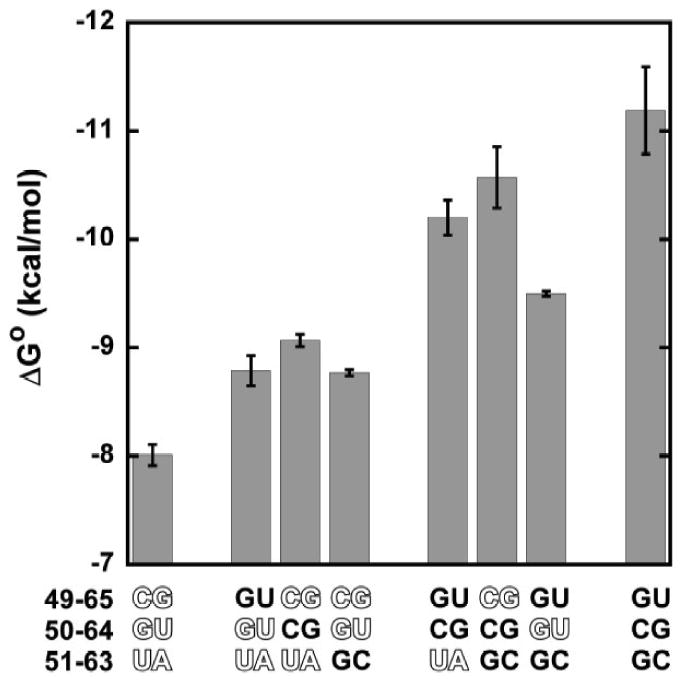
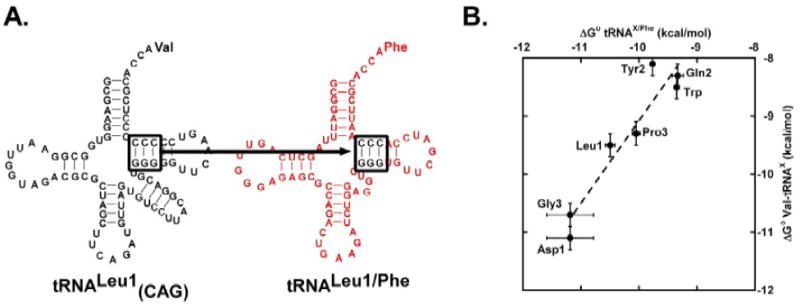
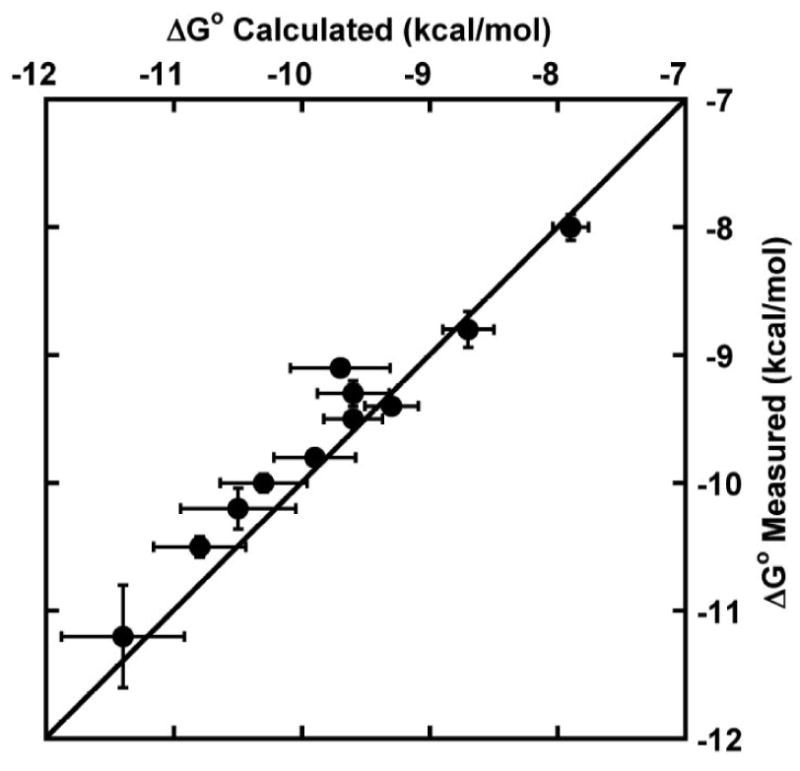
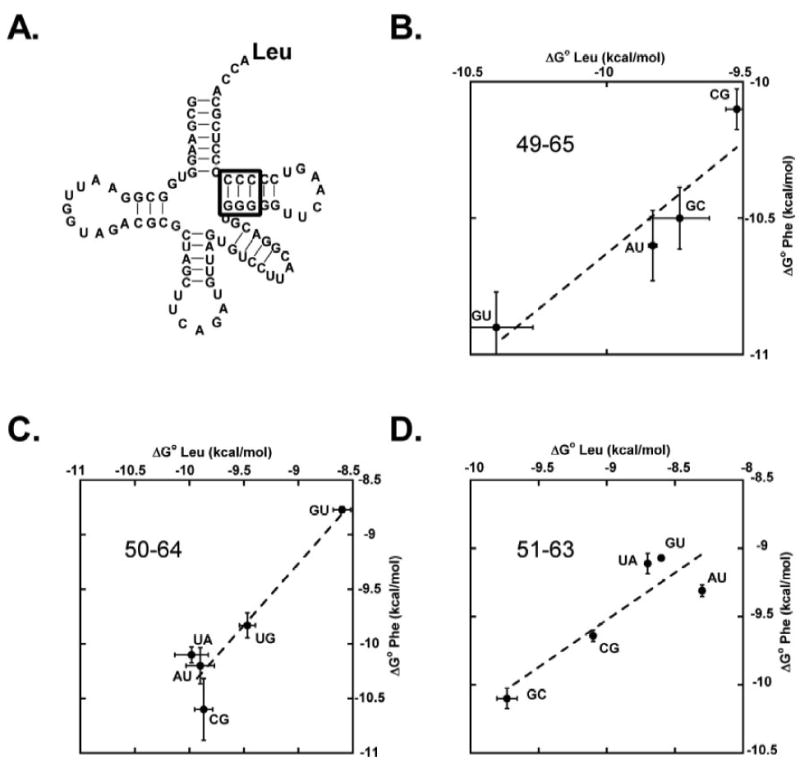
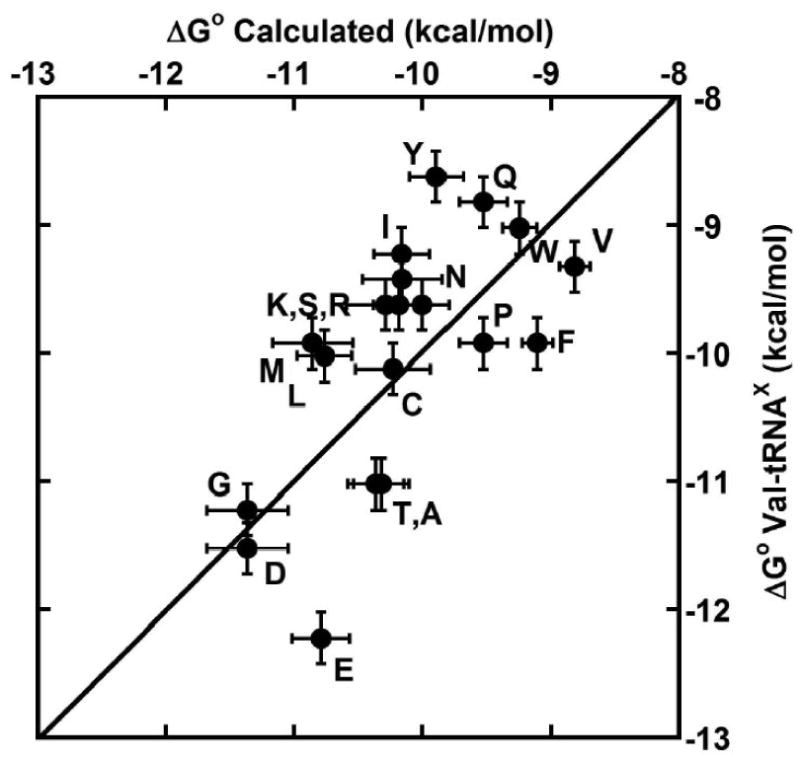
Measuring the binding affinities of 42 single-base-pair mutants in the acceptor and T Psi C stems of Saccharomyces cerevisiae tRNA Phe to Thermus thermophilus elongation factor Tu (EF-Tu) revealed that much of the specificity for tRNA occurs at the 49-65, 50-64, and 51-63 base pairs. Introducing the same mutations at the three positions into Escherichia coli tRNA CAG Leu resulted in similar changes in binding affinity. Swapping the three pairs from several E. coli tRNAs into yeast tRNA Phe resulted in chimeras with EF-Tu binding affinities similar to those for the donor tRNA. Finally, analysis of double- and triple-base-pair mutants of tRNA Phe showed that the thermodynamic contributions at the three sites are additive, permitting reasonably accurate prediction of the EF-Tu binding affinity for all E. coli tRNAs. Thus, it appears that the thermodynamic contributions of three base pairs in the T Psi C stem primarily account for tRNA binding specificity to EF-Tu.
Figures
Similar articles
-
The 51-63 base pair of tRNA confers specificity for binding by EF-Tu.RNA. 2007 Jun;13(6):835-40. doi: 10.1261/rna.485307. Epub 2007 Apr 20. RNA. 2007. PMID: 17449728 Free PMC article.
-
The tRNA specificity of Thermus thermophilus EF-Tu.Proc Natl Acad Sci U S A. 2002 Mar 19;99(6):3499-504. doi: 10.1073/pnas.052028599. Epub 2002 Mar 12. Proc Natl Acad Sci U S A. 2002. PMID: 11891293 Free PMC article.
-
Identification of thermodynamically relevant interactions between EF-Tu and backbone elements of tRNA.J Mol Biol. 2001 May 18;308(5):895-905. doi: 10.1006/jmbi.2001.4612. J Mol Biol. 2001. PMID: 11352580
-
tRNA-ribosome interactions.Biochem Cell Biol. 1995 Nov-Dec;73(11-12):1049-54. doi: 10.1139/o95-112. Biochem Cell Biol. 1995. PMID: 8722020 Review.
-
The ternary complex of aminoacylated tRNA and EF-Tu-GTP. Recognition of a bond and a fold.Biochimie. 1996;78(11-12):921-33. doi: 10.1016/s0300-9084(97)86714-4. Biochimie. 1996. PMID: 9150869 Review.
Cited by
-
Outwitting EF-Tu and the ribosome: translation with d-amino acids.Nucleic Acids Res. 2015 Jul 13;43(12):5687-98. doi: 10.1093/nar/gkv566. Epub 2015 May 30. Nucleic Acids Res. 2015. PMID: 26026160 Free PMC article.
-
β-Amino Acids Reduce Ternary Complex Stability and Alter the Translation Elongation Mechanism.ACS Cent Sci. 2024 Jun 4;10(6):1262-1275. doi: 10.1021/acscentsci.4c00314. eCollection 2024 Jun 26. ACS Cent Sci. 2024. PMID: 38947208 Free PMC article.
-
Rationally evolving tRNAPyl for efficient incorporation of noncanonical amino acids.Nucleic Acids Res. 2015 Dec 15;43(22):e156. doi: 10.1093/nar/gkv800. Epub 2015 Aug 6. Nucleic Acids Res. 2015. PMID: 26250114 Free PMC article.
-
Contribution of tRNA sequence and modifications to the decoding preferences of E. coli and M. mycoides tRNAGlyUCC for synonymous glycine codons.Nucleic Acids Res. 2024 Feb 9;52(3):1374-1386. doi: 10.1093/nar/gkad1136. Nucleic Acids Res. 2024. PMID: 38050960 Free PMC article.
-
A discriminator code-based DTD surveillance ensures faithful glycine delivery for protein biosynthesis in bacteria.Elife. 2018 Aug 9;7:e38232. doi: 10.7554/eLife.38232. Elife. 2018. PMID: 30091703 Free PMC article.
References
-
- Krab IM, Parmeggiani A. EF-Tu, a GTPase odyssey. Biochim Biophys Acta. 1998;1443:1–22. - PubMed
-
- Louie A, Ribeiro NS, Reid BR, Jurnak F. Relative affinities of all Escherichia coli aminoacyl-tRNAs for elongation factor Tu-GTP. J Biol Chem. 1984;259:5010–6. - PubMed
-
- LaRiviere FJ, Wolfson AD, Uhlenbeck OC. Uniform binding of aminoacyl-tRNAs to elongation factor Tu by thermodynamic compensation. Science. 2001;294:165–8. - PubMed
-
- Dale T, Sanderson LE, Uhlenbeck OC. The affinity of elongation factor Tu for an aminoacyl-tRNA is modulated by the esterified amino acid. Biochemistry. 2004;43:6159–66. - PubMed
Publication types
MeSH terms
Substances
Grants and funding
LinkOut - more resources
Full Text Sources
Other Literature Sources
Molecular Biology Databases
