. 2009 Jun;10(6):655-64.
doi: 10.1038/ni.1735.

RAG-1 and ATM coordinate monoallelic recombination and nuclear positioning of immunoglobulin loci

Affiliations

RAG-1 and ATM coordinate monoallelic recombination and nuclear positioning of immunoglobulin loci

Susannah L Hewitt et al. Nat Immunol. 2009 Jun.

Erratum in

  • Nat Immunol. 2009 Jun;10(6). doi: 10.1038/ni.1735
  • Nat Immunol. 2009 Sep;10(9):1034
  • Nat Immunol. 2010 Mar;11(4):355-6

Abstract

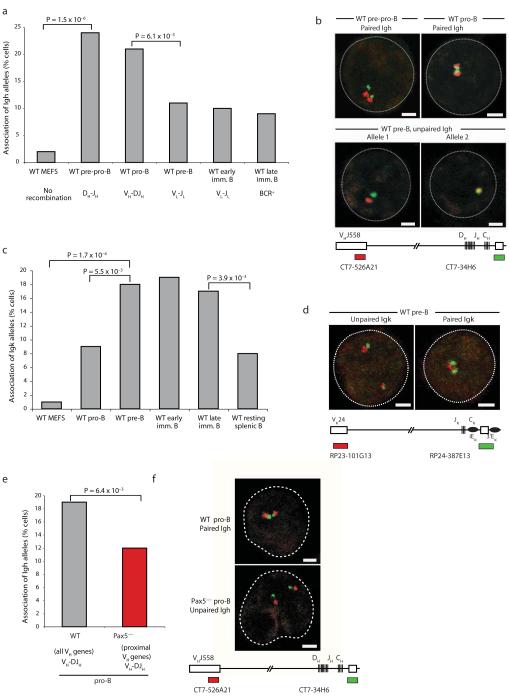
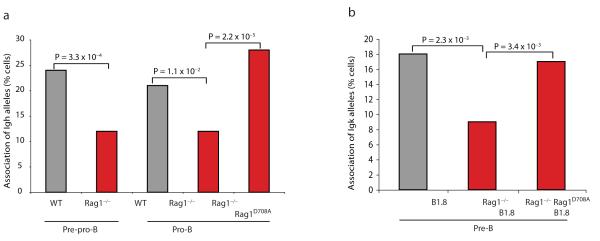
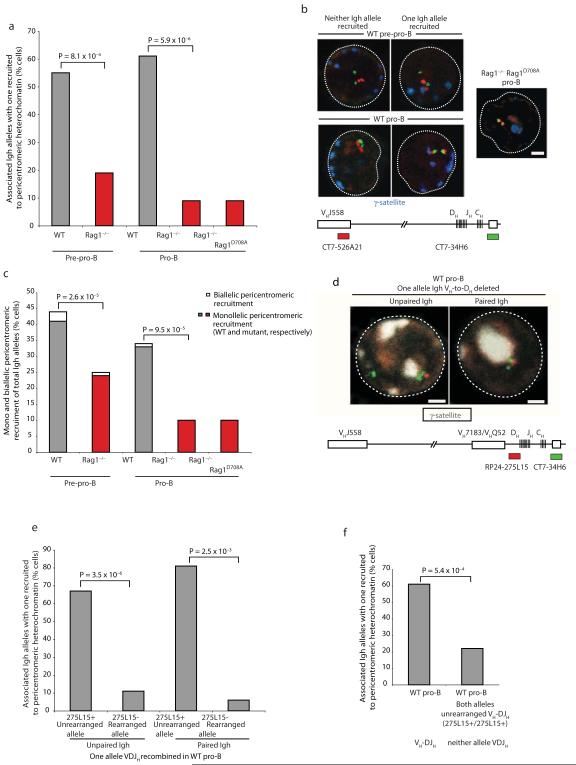
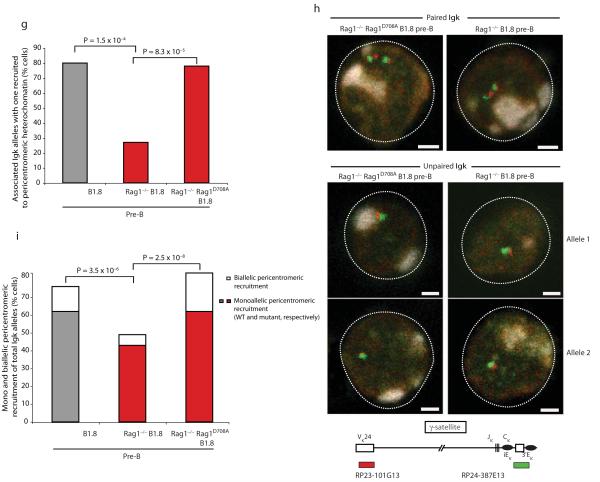
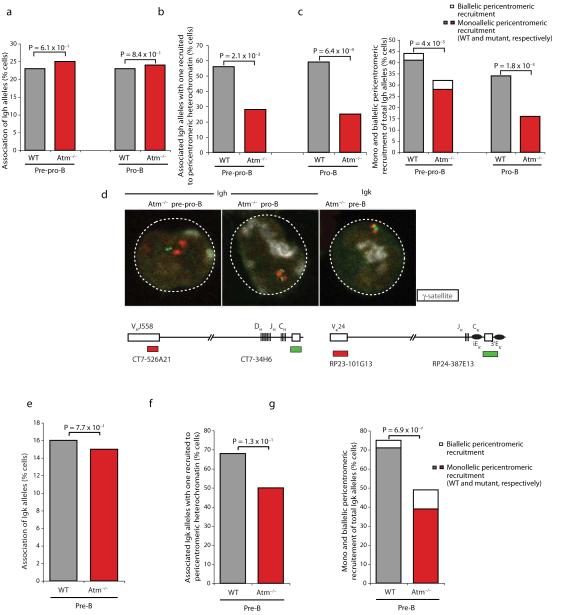
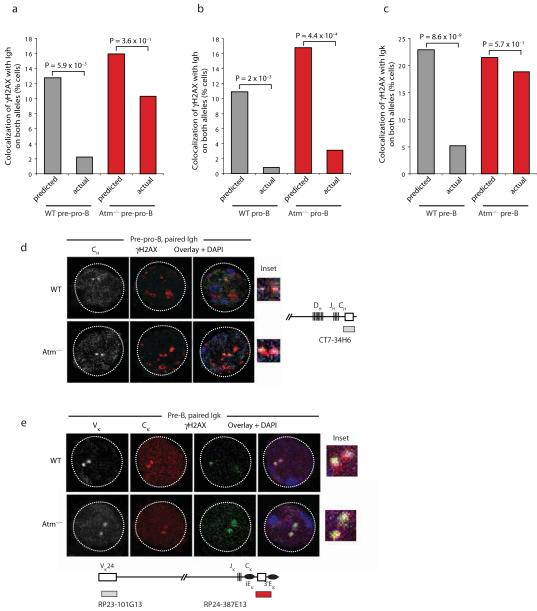
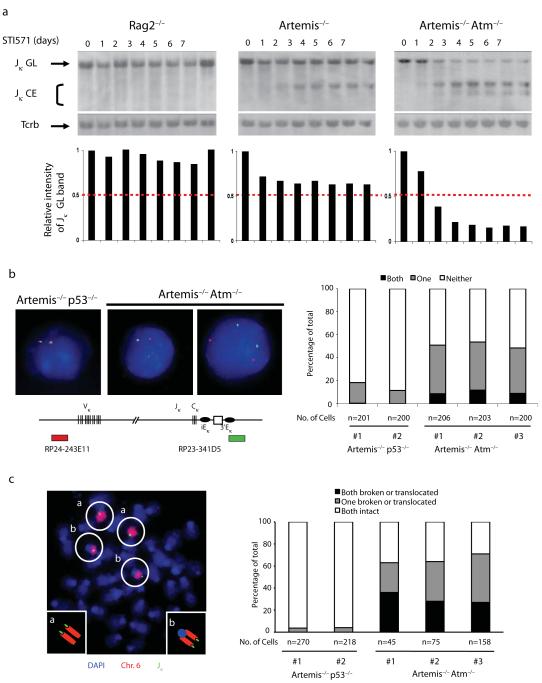
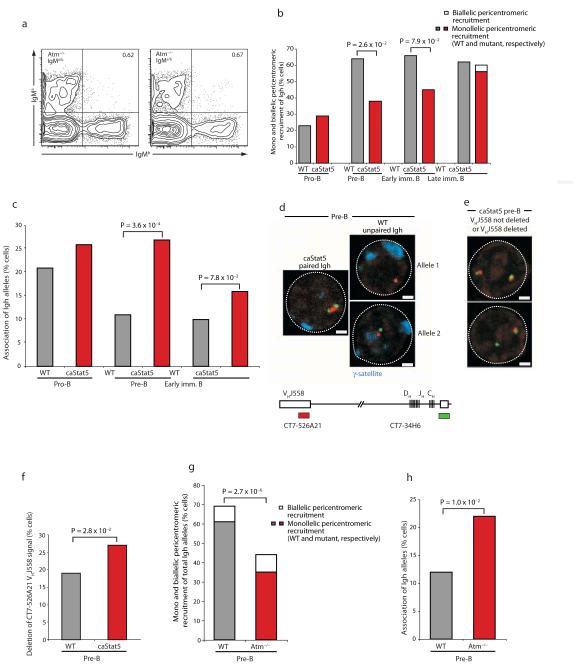
Coordinated recombination of homologous antigen receptor loci is thought to be important for allelic exclusion. Here we show that homologous immunoglobulin alleles pair in a stage-specific way that mirrors the recombination patterns of these loci. The frequency of homologous immunoglobulin pairing was much lower in the absence of the RAG-1-RAG-2 recombinase and was restored in Rag1-/- developing B cells with a transgene expressing a RAG-1 active-site mutant that supported DNA binding but not cleavage. The introduction of DNA breaks on one immunoglobulin allele induced ATM-dependent repositioning of the other allele to pericentromeric heterochromatin. ATM activated by the cleaved allele acts in trans on the uncleaved allele to prevent biallelic recombination and chromosome breaks or translocations.


Figures

Figure 1
Figure 1
Homologous pairing of Igh and Igk alleles occurs during recombination. (a) Graph indicating the frequency of inter-allelic Igh pairing. 3-D DNA FISH analysis was carried out on ex vivo sorted cells of the indicated lineage and developmental stage. Pre-pro-B cells were sorted as lineage marker negative (Lin-), B220+, CD19-, cKit+, CD25-, IgM-. Pro-B cells were sorted as CD19+, cKit+, CD25-, IgM-, pre-B cells as cKit-, CD19+, CD25+, IgM-, early immature B cells as CD19+, IgMlo, IgD- and late immature B cells as CD19+, IgMhi, IgD-. (Supplementary Fig.1 and Methods online). Murine embryonic fibroblasts (MEFs) were obtained from E13.5-15.5 embryos and cultured for four days in vitro. DNA probes were generated from two bacterial artificial chromosomes, BACs CT7-526A21 (red signal) and CT7-34H6 (green signal), which map to the distal VH gene region located at the 5′ end of the Igh locus and the 3′ constant (CH) region, respectively. Pairing was determined by measuring the distance separating the two alleles. A cut-off separation of 1μm was used to define pairing. Data are representative of more than three independent experiments. The rearrangement status of the cells analyzed is indicated below each bar of the graph. Selected statistical significances according to the χ2 test are shown between biologically relevant pairs. See Supplementary Table 1 for complete statistical results. (b) Confocal sections representative of paired and separated Igh alleles at the indicated stage of development. Decontracted Igh alleles are shown in pre-pro-B cells and contracted Igh alleles are shown in pro-B cells. A schematic representation of the position of probes used for detecting the different regions of Igh in the 3-D DNA FISH analyses is shown. (c) Graph indicating the frequency of inter-allelic Igk pairing. 3-D DNA FISH analysis was carried out on ex vivo sorted cells of the indicated lineage and developmental stage. DNA probes used were generated from two bacterial artificial chromosomes, RP23-101G13 (red signal) and RP24-387E13 (green signal), which map to the distal Vκ24 gene region located at the 5′ end of the Igk locus and the 3′ constant (Cκ) region, respectively. (d) Confocal sections representative of paired and separated Igk alleles at the indicated stage of development. A schematic representation of the position of probes used for detecting the different regions of Igk in the 3-D DNA FISH analyses is shown. (e) Graph showing the frequency of inter-allelic Igh pairing in wild-type and Pax5–/– cultured pro B cells. The rearrangement status of the cells analyzed is indicated below the appropriate bar of the graph. (f) Confocal sections representative of paired contracted Igh alleles in wild-type pro-B cells and separated decontracted alleles in Pax5–/– pro-B cells. For all graphs selected statistical results are shown, see Supplementary Tables 1 and 2 online for complete statistical results. All data are representative of more than three independent experiments.
Figure 2
Figure 2
RAG1 contributes to homologous pairing of Igh and Igk alleles. (a) Graph indicating the frequency of inter-allelic Igh pairing in wild-type, Rag1–/– and in Rag1–/– pro-B cells containing the Rag1 transgene with the active site mutation D708A. DNA FISH experiments were carried out as described for Fig. 1. (b) Graph indicating the frequency of inter-allelic Igk pairing in B1.8, B1.8 Rag1–/– and in B1.8 Rag1–/– pre-B cells containing the Rag1 transgene with the active site mutation D708A. Selected statistical results are shown. See Supplementary Tables 1 and 2 for complete statistical results. Data are representative of at least three independent experiments.
Figure 3
Figure 3
RAG1 differentially marks paired Ig alleles as defined by their location within euchromatic and heterochromatic regions of the nucleus. (a) Graph showing the frequency with which paired Igh alleles are positioned at pericentromeric heterochromatin in wild-type and Rag1–/– pre-pro-B and pro-B cells in addition to Rag1–/– pro-B cells containing a Rag1-D708A transgene. Alleles that are not located at pericentromeric heterochromatin are positioned within euchromatic regions of the nucleus. 3-D DNA FISH analysis was carried out on ex vivo sorted cells of the indicated lineage and developmental stage as described for Fig.1. DNA probes used were CT7-526A21 (red signal) and CT7-34H6 (green signal), which map to the distal VH gene region located at the 5′ end of the Igh locus and the 3′ constant (CH) region, respectively. A γ-satellite probe was used to detect pericentromeric heterochromatin. (b) Left panels — confocal sections representative of wild-type pre-pro-B and pro-B cells in which paired Igh alleles are equivalently located in euchromatin or differentially marked with one allele juxtaposed at pericentromeric heterochromatin. Right panel — confocal section representative of paired Igh alleles relative to pericentromeric heterochromatin in Rag1–/– pro-B cells containing the Rag1-D708A transgene. A schematic representation of the position of probes used for detecting the different regions of Igh in the 3-D DNA FISH analyses is shown. A γ-satellite probe was used to detect pericentromeric heterochromatin (blue signal). (c) Mono and biallelic pericentromeric recruitment of all Igh alleles in wild-type, Rag1–/– and Rag1–/– pre-pro-B and pro-B cells and pro-B cells containing the Rag1-D708A transgene. (d) Confocal sections representative of unpaired and paired Igh alleles relative to pericentromeric heterochromatin in cells with one rearranged VDJH allele. Unrearranged alleles are indicated by the presence of a BAC signal for the VH to DH region RP24-275L15 (red signal), alongside a CH CT7-34H6 probe (green signal). A schematic representation of the position of probes used for detecting the different regions of Igh in the 3-D DNA FISH analyses is shown. A γ-satellite probe was used to detect pericentromeric heterochromatin (white signal). Rearranged alleles are indicated by the presence of a single BAC signal, CT7-34H6 (green signal). (e) Graph showing the frequency with which rearranged or unrearranged Igh alleles are positioned at pericentromeric heterochromatin in cells with one VH-to-DJH rearranged allele. The analysis was performed on cells with unpaired or paired alleles, as indicated. The rearrangement status of the cells analyzed is indicated below the graph. (f) Graph showing the frequency with which paired Igh alleles are positioned at pericentromeric heterochromatin in wild-type pro-B cells irrespective of rearrangement status and in comparison to paired unrearranged alleles containing the intergenic VH-DH region of the Igh locus (as judged by the presence of both BAC RP24-275L15 signals). Probes used are described in c and the rearrangement status of the cells analyzed is indicated below the appropriate bar of the graph. For all data, selected statistical results are shown. See Supplementary Tables 4, 5 and 6 for complete statistical results. All data are representative of three independent experiments. Figure 3 part 2 (g) Graph showing the frequency with which paired Igk alleles are positioned at pericentromeric heterochromatin in B1.8, B1.8 Rag1–/– and B1.8 Rag1–/– pre-B cells containing the Rag1 transgene with the active site mutation D708A. Probes used were RP23-101G13 (red signal) and RP24-387E13 (green signal), which map to the distal Vκ24 gene region located at the 5′ end of the Igk locus and the and the 3′ constant (Cκ) region, respectively. (h) Upper panels — Confocal sections representative of differentially marked paired alleles in B1.8 and B1.8 Rag1–/– pre-B cells containing the Rag1 transgene with the active site mutation D708A and paired alleles located equivalently in euchromatic regions in Rag1–/– pre-B cells. A γ-satellite probe (white signal) was used to detect pericentromeric heterochromatin. Lower panels — Confocal sections showing the position of unpaired Igk alleles relative to pericentromeric heterochromatin in B1.8 Rag1–/– and B1.8 Rag1–/– pre-B cells containing the Rag1 transgene with the active site mutation D708A. (i). Mono and biallelic pericentromeric recruitment of all Igk alleles in B1.8, B1.8 Rag1–/– and B1.8 Rag1–/– pre-B cells containing the Rag1 transgene with the active site mutation D708A. For all graphs selected statistical results are shown. See Supplementary Tables 7 and 8 for complete statistical results. Results are representative of three independent experiments.
Figure 3
Figure 3
RAG1 differentially marks paired Ig alleles as defined by their location within euchromatic and heterochromatic regions of the nucleus. (a) Graph showing the frequency with which paired Igh alleles are positioned at pericentromeric heterochromatin in wild-type and Rag1–/– pre-pro-B and pro-B cells in addition to Rag1–/– pro-B cells containing a Rag1-D708A transgene. Alleles that are not located at pericentromeric heterochromatin are positioned within euchromatic regions of the nucleus. 3-D DNA FISH analysis was carried out on ex vivo sorted cells of the indicated lineage and developmental stage as described for Fig.1. DNA probes used were CT7-526A21 (red signal) and CT7-34H6 (green signal), which map to the distal VH gene region located at the 5′ end of the Igh locus and the 3′ constant (CH) region, respectively. A γ-satellite probe was used to detect pericentromeric heterochromatin. (b) Left panels — confocal sections representative of wild-type pre-pro-B and pro-B cells in which paired Igh alleles are equivalently located in euchromatin or differentially marked with one allele juxtaposed at pericentromeric heterochromatin. Right panel — confocal section representative of paired Igh alleles relative to pericentromeric heterochromatin in Rag1–/– pro-B cells containing the Rag1-D708A transgene. A schematic representation of the position of probes used for detecting the different regions of Igh in the 3-D DNA FISH analyses is shown. A γ-satellite probe was used to detect pericentromeric heterochromatin (blue signal). (c) Mono and biallelic pericentromeric recruitment of all Igh alleles in wild-type, Rag1–/– and Rag1–/– pre-pro-B and pro-B cells and pro-B cells containing the Rag1-D708A transgene. (d) Confocal sections representative of unpaired and paired Igh alleles relative to pericentromeric heterochromatin in cells with one rearranged VDJH allele. Unrearranged alleles are indicated by the presence of a BAC signal for the VH to DH region RP24-275L15 (red signal), alongside a CH CT7-34H6 probe (green signal). A schematic representation of the position of probes used for detecting the different regions of Igh in the 3-D DNA FISH analyses is shown. A γ-satellite probe was used to detect pericentromeric heterochromatin (white signal). Rearranged alleles are indicated by the presence of a single BAC signal, CT7-34H6 (green signal). (e) Graph showing the frequency with which rearranged or unrearranged Igh alleles are positioned at pericentromeric heterochromatin in cells with one VH-to-DJH rearranged allele. The analysis was performed on cells with unpaired or paired alleles, as indicated. The rearrangement status of the cells analyzed is indicated below the graph. (f) Graph showing the frequency with which paired Igh alleles are positioned at pericentromeric heterochromatin in wild-type pro-B cells irrespective of rearrangement status and in comparison to paired unrearranged alleles containing the intergenic VH-DH region of the Igh locus (as judged by the presence of both BAC RP24-275L15 signals). Probes used are described in c and the rearrangement status of the cells analyzed is indicated below the appropriate bar of the graph. For all data, selected statistical results are shown. See Supplementary Tables 4, 5 and 6 for complete statistical results. All data are representative of three independent experiments. Figure 3 part 2 (g) Graph showing the frequency with which paired Igk alleles are positioned at pericentromeric heterochromatin in B1.8, B1.8 Rag1–/– and B1.8 Rag1–/– pre-B cells containing the Rag1 transgene with the active site mutation D708A. Probes used were RP23-101G13 (red signal) and RP24-387E13 (green signal), which map to the distal Vκ24 gene region located at the 5′ end of the Igk locus and the and the 3′ constant (Cκ) region, respectively. (h) Upper panels — Confocal sections representative of differentially marked paired alleles in B1.8 and B1.8 Rag1–/– pre-B cells containing the Rag1 transgene with the active site mutation D708A and paired alleles located equivalently in euchromatic regions in Rag1–/– pre-B cells. A γ-satellite probe (white signal) was used to detect pericentromeric heterochromatin. Lower panels — Confocal sections showing the position of unpaired Igk alleles relative to pericentromeric heterochromatin in B1.8 Rag1–/– and B1.8 Rag1–/– pre-B cells containing the Rag1 transgene with the active site mutation D708A. (i). Mono and biallelic pericentromeric recruitment of all Igk alleles in B1.8, B1.8 Rag1–/– and B1.8 Rag1–/– pre-B cells containing the Rag1 transgene with the active site mutation D708A. For all graphs selected statistical results are shown. See Supplementary Tables 7 and 8 for complete statistical results. Results are representative of three independent experiments.
Figure 4
Figure 4
ATM directs repositioning of one Ig allele to pericentromeric heterochromatin. (a) Graph indicating the frequency of interallelic Igh pairing in wild-type and Atm–/– pre-pro-B and pro-B cells. The developmental profile of Atm–/– compared to wild-type sorted bone marrow primary B lymphocytes is described in Supplementary Fig. 2 (online). (b) Graph showing the frequency with which paired Igh alleles are positioned at pericentromeric heterochromatin in wild-type and Atm–/– pre-pro-B and pro-B cells. (c) Mono and biallelic pericentromeric recruitment of total Igh alleles in wild-type and Atm–/– pre-pro-B and pro-B cells. (d) Confocal sections showing the position of undifferentially marked paired Igh and Igk alleles at the indicated stages of development. Probes used in these experiments are indicated. (e) Graph indicating the frequency of interallelic Igk pairing in wild-type and Atm-/- pre-B cells. (f) Graph showing the frequency with which paired Igk alleles are positioned at pericentromeric heterochromatin in wild-type and Atm–/– pre-B cells. (g) Mono and biallelic pericentromeric recruitment of Igk in wild-type and Atm–/– pre-B cells. For all graphs selected statistical results are shown. See Supplementary Tables 1, 2, 5, 6, 7 and 8 for complete statistical results. All results shown are representative of three independent experiments.
Figure 5
Figure 5
ATM prevents bi-allelic RAG-mediated cleavage during Ig V(D)J rearrangement. (a) Graph showing the predicted and actual percentages of cells with biallelic colocalization of γ-H2AX on Igh in wild-type and Atm–/– pre-pro-B cells. This percentage is calculated based on the total percentage of pre-pro-B cells with mono or biallelic colocalization of γ-H2AX on Igh alleles. (b) Graph showing the predicted and actual percentages of cells with biallelic colocalization of γ-H2AX on Igh in wild-type and Atm–/– pro-B cells. This percentage is calculated based on the total percentage of pro-B cells with mono or biallelic colocalization of γ-H2AX on Igh alleles. (c) Graph showing the predicted and actual percentages of cells with biallelic colocalization of γ-H2AX on Igk in wild-type and Atm–/– pre-B cells. This percentage is calculated based on the total percentage of pre-B cells with mono or biallelic colocalization of γ-H2AX on Igk alleles. (d) Individual and merged confocal microscopy sections indicate the localization of γ-H2AX foci on Igh alleles in sorted wild-type and Atm–/– pre-pro-B cells. Immunofluorescence staining indicates γ-H2AX foci (red). The DNA probe CT7-526A21 (white signal) indicates the position of the 3′ constant (CH) region. Representative cells show paired Igh alleles with γ-H2AX localized mono-allelically in wild-type pre-pro-B cells and bi-allelically in Atm–/– pre-pro-B cells. Right hand panels show enlarged Igh alleles. (e) Individual and merged confocal microscopy sections indicate the localization of γ-H2AX foci on Igk alleles in sorted wild-type and Atm–/– pre-B cells. Immunofluorescence staining indicates γ-H2AX foci (green). DNA probes RP23-101G13 (white signal) and RP24-387E13 (red signal) indicate the position of the distal Vκ gene region located at the 5′ end of the Igk locus and the 3′ constant (Cκ) region, respectively. Representative cells show paired Igk alleles with γ-H2AX localized mono-allelically in wild-type pre-B cells and bi-allelically in Atm–/– pre-B cells. Right hand panels show enlarged Igk alleles. For all graphs selected statistical results are shown. See Supplementary Tables 9 and 10 for complete statistical analysis. All results shown are representative of three independent experiments.
Figure 6
Figure 6
ATM prevents bi-allelic Igk chromosome breaks and translocations. (a) Southern blot analysis of the Igk locus was performed on BamHI-digested genomic DNA isolated from Rag2–/–, Artemis–/–, and Artemis–/–Atm–/– Abelson pre-B cell lines treated with STI571 for the indicated number of days. The top panel depicts blots hybridized with a 3′Jκ probe. Bands corresponding to germline Igk (Jκ GL) and un-repaired Jκ coding ends (Jκ CE) are indicated. The same blots were stripped and re-hybridized with a Tcrb locus probe to account for DNA amounts. The intensity of the germline Jκ band was normalized to that of the Tcrb band to represent RAG-mediated Igk cutting within each population of cells. (b) Quantification of RAG-induced Igk genomic instability during V(D)J recombination in pre-B cell lines. Left, representative light microscopy images of two-color FISH analysis conducted on G1 phase nuclei of STI571 treated Artemis–/–p53–/– and Artemis–/–Atm–/– pre-B cells using a 5′Vκ BAC (red signal) and 3′Cκ BAC (green signal) and DAPI to visualize DNA. Right, graph showing the number and percentage of Artemis–/–p53–/– and Artemis–/–Atm–/– pre-B cells with coincident (C) and non-coincident (NC) hybridization of the 5′Vκ and 3′Cκ signals. The percentages of cells with separated signals on both alleles are statistically different (P = 0.005) between Artemis–/–p53–/– and Artemis–/–Atm–/– pre-B cells. (c) Quantification of RAG-induced Igk chromosome breaks or translocations during V(D)J recombination in pre-B cell lines. Left, representative light microscopy images of whole chromosome 6 (red) paints and FISH analysis using the 5′Vκ and 3′Cκ BACs (green signals) and DAPI (blue) to visualize DNA on metaphases prepared from STI571-treated and released Artemis–/–p53–/– and Artemis–/– Atm–/– pre-B cells. Right, graph showing the percentage of STI571 treated and released pre-B cell lines with Igk chromosome breaks or translocations on one or both copies of chromosome 6. All data shown are representative of at least three independent experiments.
Figure 7
Figure 7
Igh pairing can occur beyond the pro-B cell stage if locus accessibility is maintained. (a) Flow cytometric analysis of bone marrow cells from wild-type and Atm–/– mice heterozygous for two allotypically marked Igh alleles. (b) Graph showing mono- and biallelic recruitment of Igh at different developmental stages in ex vivo sorted wild-type (grey bars) and caStat5 (red bars) B lymphocytes. 3-D DNA FISH was carried out as described for Fig. 1. (c) Graph showing frequency of association of Igh alleles in sorted wild-type and caStat5 pre-B and immature B cells. (d) Confocal sections showing tightly paired Igh alleles in a caStat5 pre-B cell. Representative confocal sections indicate the position and conformation of non-associating Igh alleles in a wild-type pre-B cell. DNA probes used in the FISH experiments are as indicated. (e) Confocal sections showing cells with (right) and without (left) deletion of one CT7-526A21 VHJ558 signal. Probes used in this experiment are indicated in d. (f) The frequency of deletion of the CT7-526A21 VHJ558 signal in wild-type and caStat5 pre-B cells is shown in the graph. (g) Graph showing mono- and biallelic recruitment of Igh at in ex vivo sorted wild-type (grey bars) and Atm–/– (red bars) pre-B cells. (h) Graph showing frequency of association of Igh alleles in sorted wild-type (grey bars) and Atm–/– (red bars) pre-B cells. For all graphs, selected statistical results are shown. See Supplementary Table 6 and 8 for complete statistical results. All results shown are representative of three independent experiments.

Similar articles

Cited by

References

    1. Hesslein DG, Schatz DG. Factors and forces controlling V(D)J recombination. Adv Immunol. 2001;78:169–232. - PubMed
    1. Bassing CH, Swat W, Alt FW. The mechanism and regulation of chromosomal V(D)J recombination. Cell. 2002;109(Suppl):S45–55. - PubMed
    1. Hsu LY, et al. A conserved transcriptional enhancer regulates RAG gene expression in developing B cells. Immunity. 2003;19:105–17. - PubMed
    1. Gellert M. V(D)J recombination: RAG proteins, repair factors, and regulation. Annu Rev Biochem. 2002;71:101–32. - PubMed
    1. Roth DB. Restraining the V(D)J recombinase. Nat Rev Immunol. 2003;3:656–66. - PubMed

Publication types