

A protective function for interleukin 17A in T cell-mediated intestinal inflammation
- PMID: 19448631
- PMCID: PMC2709990
- DOI: 10.1038/ni.1736
A protective function for interleukin 17A in T cell-mediated intestinal inflammation
Abstract
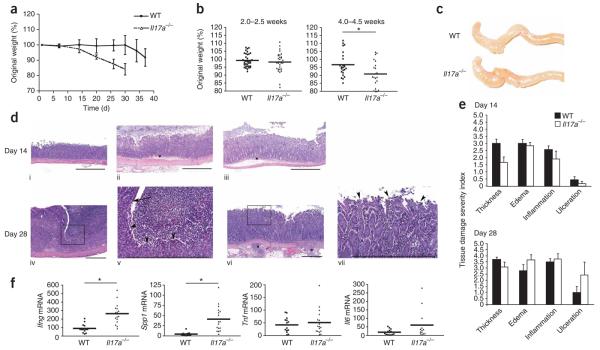
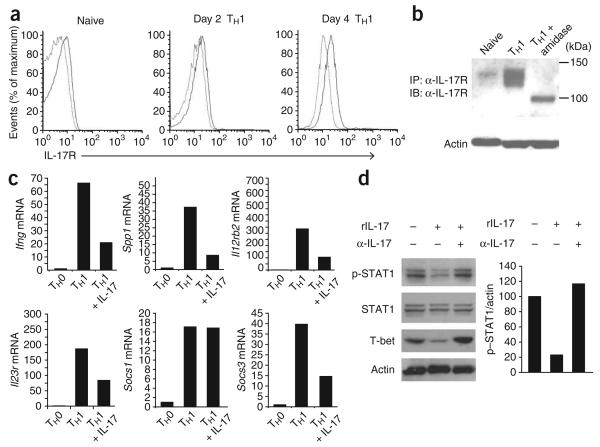
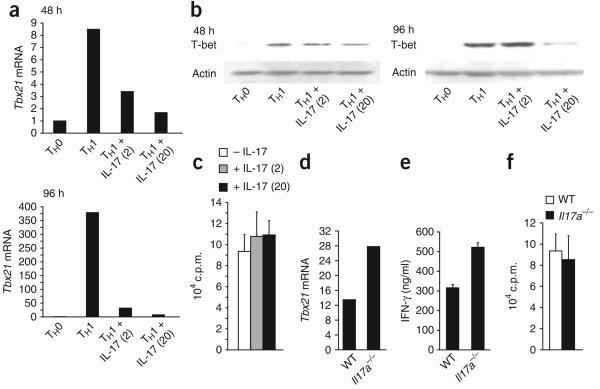
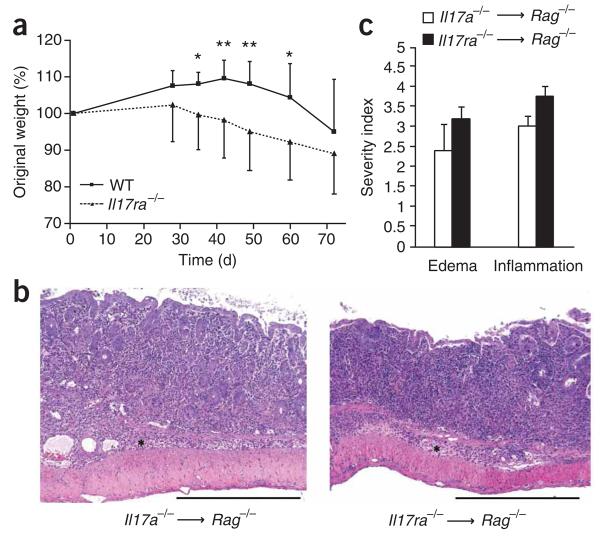
Interleukin 23 (IL-23) and IL-17 have been linked to the pathogenesis of several chronic inflammatory disorders, including inflammatory bowel disease. Yet as an important function for IL-23 is emerging, the function of IL-17 in inflammatory bowel disease remains unclear. Here we demonstrate IL-17A-mediated protection in the CD45RBhi transfer model of colitis. An accelerated wasting disease elicited by T cells deficient in IL-17A correlated with higher expression of genes encoding T helper type 1-type cytokines in colon tissue. IL-17A also modulated T helper type 1 polarization in vitro. Furthermore, T cells deficient in the IL-17 receptor elicited an accelerated, aggressive wasting disease relative to that elicited by wild-type T cells in recipient mice. Our data demonstrate a protective function for IL-17 and identify T cells as not only the source but also a target of IL-17 in vivo.
Figures
Comment in
-
IL-17A directly inhibits TH1 cells and thereby suppresses development of intestinal inflammation.Nat Immunol. 2009 Jun;10(6):568-70. doi: 10.1038/ni0609-568. Nat Immunol. 2009. PMID: 19448657 No abstract available.
Similar articles
-
KSR1 protects from interleukin-10 deficiency-induced colitis in mice by suppressing T-lymphocyte interferon-γ production.Gastroenterology. 2011 Jan;140(1):265-74. doi: 10.1053/j.gastro.2010.09.041. Epub 2010 Sep 25. Gastroenterology. 2011. PMID: 20875416 Free PMC article.
-
Microbial amyloids induce interleukin 17A (IL-17A) and IL-22 responses via Toll-like receptor 2 activation in the intestinal mucosa.Infect Immun. 2012 Dec;80(12):4398-408. doi: 10.1128/IAI.00911-12. Epub 2012 Oct 1. Infect Immun. 2012. PMID: 23027540 Free PMC article.
-
TL1A (TNFSF15) regulates the development of chronic colitis by modulating both T-helper 1 and T-helper 17 activation.Gastroenterology. 2008 Aug;135(2):552-67. doi: 10.1053/j.gastro.2008.04.037. Epub 2008 May 7. Gastroenterology. 2008. PMID: 18598698 Free PMC article.
-
Lymphocyte-dependent and Th2 cytokine-associated colitis in mice deficient in Wiskott-Aldrich syndrome protein.Gastroenterology. 2007 Oct;133(4):1188-97. doi: 10.1053/j.gastro.2007.07.010. Epub 2007 Jul 12. Gastroenterology. 2007. PMID: 17764675 Free PMC article.
-
The IL-17 family cytokines in immunity and disease.J Clin Immunol. 2010 Mar;30(2):185-95. doi: 10.1007/s10875-010-9369-6. Epub 2010 Feb 23. J Clin Immunol. 2010. PMID: 20177959 Review.
Cited by
-
CD4(+) T-cell subsets in intestinal inflammation.Immunol Rev. 2013 Mar;252(1):164-82. doi: 10.1111/imr.12039. Immunol Rev. 2013. PMID: 23405904 Free PMC article. Review.
-
Th17 response and inflammatory autoimmune diseases.Int J Inflam. 2012;2012:819467. doi: 10.1155/2012/819467. Epub 2011 Nov 15. Int J Inflam. 2012. PMID: 22229105 Free PMC article.
-
Interleukin-17 (IL-17) expression is reduced during acute myocardial infarction: role on chemokine receptor expression in monocytes and their in vitro chemotaxis towards chemokines.Toxins (Basel). 2012 Nov 30;4(12):1427-39. doi: 10.3390/toxins4121427. Toxins (Basel). 2012. PMID: 23202375 Free PMC article.
-
Mechanisms regulating regional localization of inflammation during CNS autoimmunity.Immunol Rev. 2012 Jul;248(1):205-15. doi: 10.1111/j.1600-065X.2012.01126.x. Immunol Rev. 2012. PMID: 22725963 Free PMC article. Review.
-
Myeloid-derived suppressor cells in inflammatory bowel disease.Intest Res. 2015 Apr;13(2):105-11. doi: 10.5217/ir.2015.13.2.105. Epub 2015 Apr 27. Intest Res. 2015. PMID: 25931994 Free PMC article. Review.
References
-
- Langrish CL, et al. IL-12 and IL-23: master regulators of innate and adaptive immunity. Immunol. Rev. 2004;202:96–105. - PubMed
-
- Aggarwal S, Ghilardi N, Xie MH, de Sauvage FJ, Gurney AL. Interleukin-23 promotes a distinct CD4 T cell activation state characterized by the production of interleukin-17. J. Biol. Chem. 2003;278:1910–1914. - PubMed
-
- Kastelein RA, Hunter CA, Cua DJ. Discovery and biology of IL-23 and IL-27: related but functionally distinct regulators of inflammation. Annu. Rev. Immunol. 2007;25:221–242. - PubMed
-
- Oppmann B, et al. Novel p19 protein engages IL-12p40 to form a cytokine, IL-23, with biological activities similar as well as distinct from IL-12. Immunity. 2000;13:715–725. - PubMed
-
- Cua DJ, et al. Interleukin-23 rather than interleukin-12 is the critical cytokine for autoimmune inflammation of the brain. Nature. 2003;421:744–748. - PubMed
Publication types
MeSH terms
Substances
Grants and funding
LinkOut - more resources
Full Text Sources
Other Literature Sources
Molecular Biology Databases
