. 2009 Jun;119(6):1502-14.
doi: 10.1172/JCI37083. Epub 2009 May 11.

A partial form of recessive STAT1 deficiency in humans

Affiliations

A partial form of recessive STAT1 deficiency in humans

Ariane Chapgier et al. J Clin Invest. 2009 Jun.

Abstract

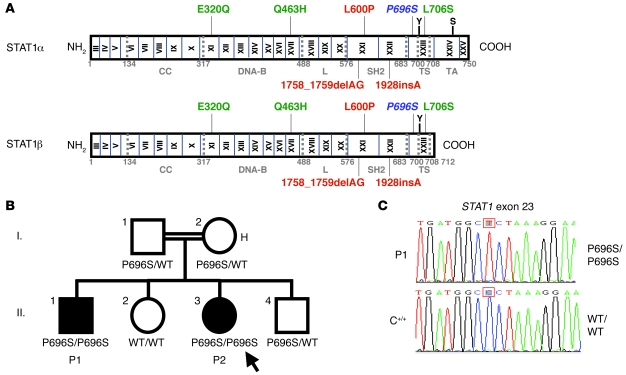
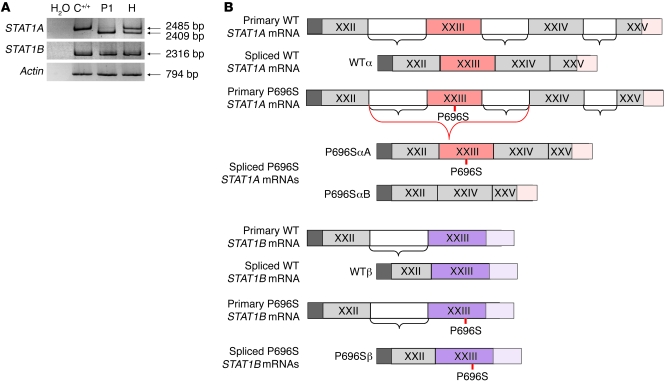
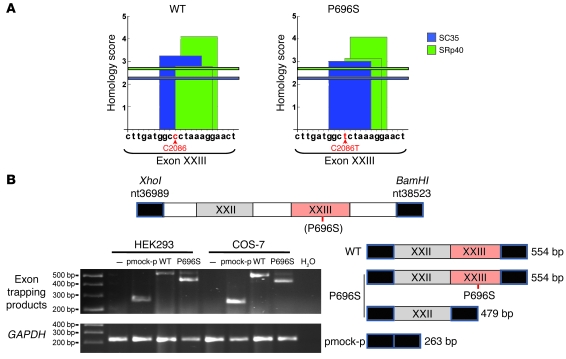
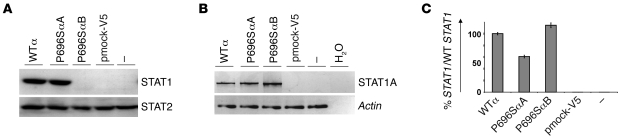
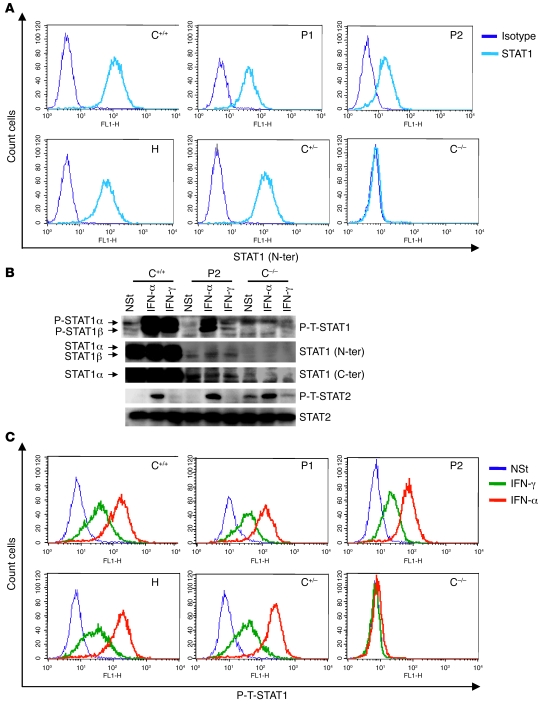
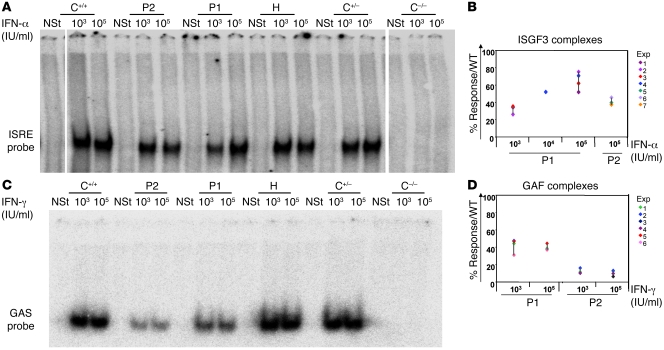
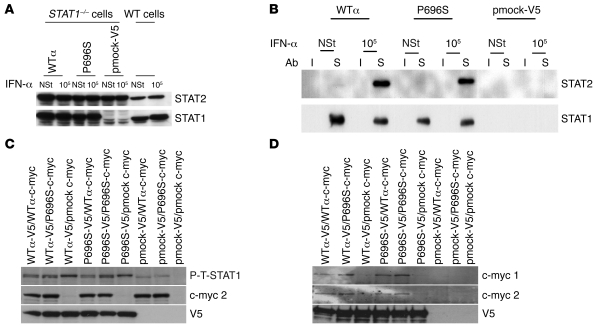
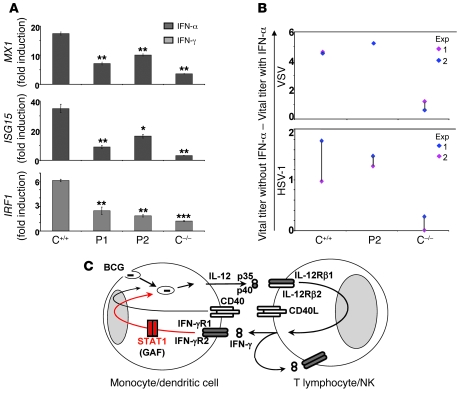
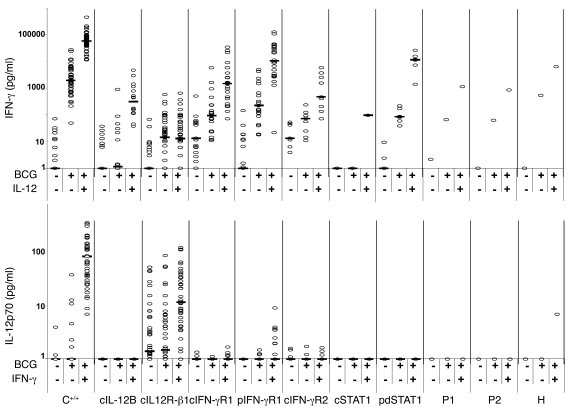
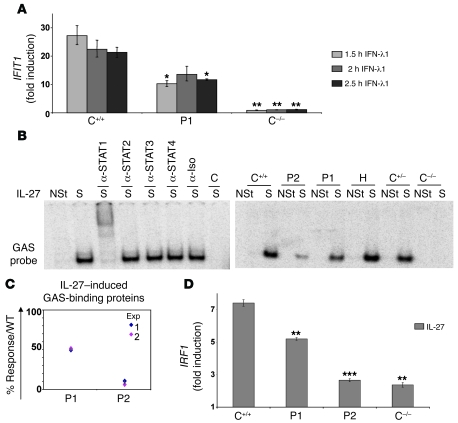
Complete STAT1 deficiency is an autosomal recessive primary immunodeficiency caused by null mutations that abolish STAT1-dependent cellular responses to both IFN-alpha/beta and IFN-gamma. Affected children suffer from lethal intracellular bacterial and viral diseases. Here we report a recessive form of partial STAT1 deficiency, characterized by impaired but not abolished IFN-alpha/beta and IFN-gamma signaling. Two affected siblings suffered from severe but curable intracellular bacterial and viral diseases. Both were homozygous for a missense STAT1 mutation: g.C2086T (P696S). This STAT1 allele impaired the splicing of STAT1 mRNA, probably by disrupting an exonic splice enhancer. The misspliced forms were not translated into a mature protein. The allele was hypofunctional, because residual full-length mRNA production resulted in low but detectable levels of normally functional STAT1 proteins. The P696S amino acid substitution was not detrimental. The patients' cells, therefore, displayed impaired but not abolished responses to both IFN-alpha and IFN-gamma. We also show that recessive STAT1 deficiencies impaired the IL-27 and IFN-lambda1 signaling pathways, possibly contributing to the predisposition to bacterial and viral infections, respectively. Partial recessive STAT1 deficiency is what we believe to be a novel primary immunodeficiency, resulting in impairment of the response to at least 4 cytokines (IFN-alpha/beta, IFN-gamma, IFN-lambda1, and IL-27). It should be considered in patients with unexplained, severe, but curable intracellular bacterial and viral infections.


Figures

Figure 1
Figure 1. STAT1 P696S is associated with salmonellosis and viral disease.
(A) Human STAT1a and STAT1b isoforms are shown, with their known pathogenic mutations. Coding exons are numbered with Roman numerals and delimited by a vertical bar. Regions corresponding to the coiled-coil domain (CC), DNA-binding domain (DNA-B), linker domain (L), SH2 domain (SH2), tail segment domain (TS), and transactivator domain (TA) are indicated in gray, together with their amino acid boundaries, and are delimited by gray dotted lines. Tyr701 (Y) and Ser727 (S) are indicated. Mutations in red are recessive and associated with complete STAT1 deficiency in homozygous individuals. Mutations in green are associated with partial STAT1 deficiency in heterozygous individuals. The mutation in blue is a partial recessive mutation associated with partial STAT1 deficiency in homozygous individuals. The mutation reported here for what we believe to be the first time is indicated in italics. (B) STAT1 genotype and clinical phenotype of the kindred. Members II.1 and II.3 presented salmonellosis, and II.3 also presented viral diseases. These 2 individuals are subsequently referred to as P1 and P2, respectively. Individuals with clinical disease are indicated in black, and healthy individuals are shown in white. The mother, who is heterozygous for the STAT1 P696S mutation, is subsequently referred to as H. STAT1 genotypes are indicated under each individual. The index case is indicated with an arrow. (C) Genomic sequences in the sense orientation of exon 23 of STAT1 in a healthy control and in P1. C+/+ indicates a healthy control.
Figure 2
Figure 2. STAT1 P696S is associated with a predominant splicing defect.
(A) PCR of full-length STAT1A, STAT1B, and ACTIN amplified from cDNA from C+/+, P1 (homozygous for the P696S STAT1 mutation), and H. The sizes of the amplicons are indicated. This result is representative of 5 independent experiments. (B) Schematic representation of the splicing events identified in STAT1A and STAT1B WT or P696S mutant. The ends of the WT and P696S STAT1 mRNAs are shown, with their corresponding spliced forms. The exons are numbered with Roman numerals and represented in gray boxes, with the introns between them shown in white boxes, with the exception of exon 23, shown in red and purple boxes in the α and β isoforms, respectively. The hatched bars at the beginning of each sequence represent the 5′ region of each mRNA. At the end of the STAT1A form, the hatched red bars represent the STAT1A polyadenylation site at the end of exon 25. At the end of STAT1B forms, the hatched purple bars represent the STAT1B polyadenylation site at the end of exon 23, which is longer than STAT1A exon 23. The open brackets represent the splicing events. Events shown in red predominate and are associated with the P696S STAT1 mutation.
Figure 3
Figure 3. STAT1 P696S would be associated with an ESE defect.
(A) ESE homology site in exon 23 predicted by the ESE finder program (25). Nucleotides from exon 23 are shown, with the C2086 nucleotide in the WT sequence and the C2086T substitution in the P696S sequence shown in red. The horizontal blue and green bars show the significance threshold homology score for the binding of SC35 and SRp40 proteins, respectively. The predicted binding sites of these proteins are shown as rectangles along the length of the nucleotide sequence at the height of the homology score. (B) The genomic STAT1 region from nucleotide 36989 to 38523 (NC_000002) was inserted into an exon-trapping vector using XhoI and BamH1, with or without the C2086T (P696S) nucleotide substitution. The exons are numbered in Roman numerals and shown in gray boxes, with the introns between them in white boxes, with the exception of exon 23, which is shown in a red box. The vector is shown as black boxes. HEK293 and COS-7 cells were transfected with the various constructs, the exon-trapping pSPL3 mock vector (pmock-p), or no vector (–). RNA was isolated, and the various spliced products were amplified and are shown on an agarose gel with GADPH amplification. The various products were isolated and sequenced, and the resulting sequences are also shown with corresponding exons and MW. These results are representative of 2 independent experiments.
Figure 4
Figure 4. Only the normal splicing STAT1 P696S form is translated.
Human cells completely lacking STAT1 (U3C cells) were transfected with the WTα, P696SαA, and P696SαB STAT1 alleles or with the V5-tagged vector containing a mock allele (pmock-V5) or were not transfected (–). (A) These cells were subjected to Western blotting analysis with specific STAT1 and STAT2 antibodies; (B) subjected to full-length PCR amplification of the STAT1A isoform and ACTIN cDNAs; and (C) subjected to relative real-time STAT1 PCR. The results were normalized with respect to GUS mRNA and are expressed as a percentage of the amount of WT STAT1 mRNA. SD from triplication of a single experiment is indicated. These results are representative of 2 independent experiments.
Figure 5
Figure 5. STAT1 P696S is associated with low levels of STAT1 in the patients’ cells.
EBV-B cells from H, C+/+, P1, P2, an individual with a single WT STAT1 allele encoding a protein (C+/–), and a patient homozygous for a mutated STAT1 allele, resulting in an absence of the protein (C–/–), were stimulated with 105 IU/ml IFN-α or IFN-γ or were left unstimulated (NSt) for 30 minutes and subjected to FACS analysis (A and C) or Western blotting (B), with specific antibodies against P-Tyr701-STAT1 (P-T-STAT1) (B and C), the STAT1 N terminus (STAT1 N-ter) (A and B) and C terminus (STAT1 C-ter) (B), P-Tyr690-STAT2 (P-T-STAT2), and STAT2 (B). The results shown are representative of 2 or 3 independent experiments.
Figure 6
Figure 6. STAT1 P696S is associated with a partial recessive defect in the activation of both ISGF3 and GAF, following stimulation with IFN-α and IFN-γ.
EMSA with nuclear extracts (5 μg) from EBV-B cells from H, C+/+, P1, P2, C+/–, and C–/– not stimulated or stimulated for 30 minutes with 103 and 105 IU/ml IFN-α (A) or IFN-γ (C). Radiolabeled ISRE (A) or GAS (C) probes were used. These results are representative of 6 or 7 independent experiments (A and C). Quantification of these 6 or 7 independent experiments by PhosphoImager SI (Molecular Dynamics), using the ISRE (B) or GAS (D) probe, in response to IFN-α (B) or IFN-γ (D). Each independent experiment (Exp) is shown in a different color. The responses are expressed as percentages of patients’ response versus a healthy control’s response (defined as 100%). Vertical lines have been drawn between maximum and minimum values. Various lanes from the same gel have been inverted in A; white dividing lines show where the image was cut.
Figure 7
Figure 7. STAT1 P696S amino acid substitution does not affect STAT1 activation.
(A and B) Immunoprecipitation with a V5-specific (S) or isotypic (I) antibody from total protein extracts (1 mg) of parental fibrosarcoma WT cell line (2C4) or STAT1-deficient U3C fibrosarcoma cells transfected with a V5-tagged vector containing a mock allele, the WTα, or P696SαA (P696S) STAT1 alleles. (A) Total protein extracts and (B) immunoprecipitates were studied by Western blotting with STAT1- and STAT2-specific antibodies. Cells were not stimulated or were stimulated for 30 minutes with 105 IU/ml IFN-α. (C and D) Immunoprecipitation with a V5-specific antibody from total protein extracts (1 mg) of STAT1-deficient U3C fibrosarcoma cells cotransfected with vectors containing a mock allele, WTα, and P696SαA STAT1 alleles tagged with V5 or with c-myc. (C) Total protein extracts and (D) immunoprecipitates were analyzed by Western blotting with specific antibodies against phosphorylated-Tyr701 STAT1, V5-specific, and c-myc–specific antibodies. The cells were not stimulated (data not shown) or stimulated for 30 minutes with 105 IU/ml IFN-α. For C and D, each blot was obtained from a different gel. Each result shown is representative of 2 independent experiments (AD).
Figure 8
Figure 8. STAT1 P696S is associated with a partial recessive defect in late responses to IFN-α and IFN-γ.
(A) Abundance of mRNA corresponding to genes induced by IFN-α and/or IFN-γ (MX1, ISG15, and IRF1) in EBV-B cells from C+/+, P1, P2, and C–/–, either not stimulated or stimulated with 105 IU/ml IFN-α or IFN-γ for 2 hours. The results are normalized with respect to GUS mRNA and are expressed as multiples (fold induction) of the unstimulated value ± SD. *P < 0.05, **P < 0.01, ***P < 0.001 when compared to C+/+. The exact P values are reported in Supplemental Table 2. Each result shown is representative of 2 to 3 independent experiments. (B) Skin-derived SV-40–transformed fibroblasts from C+/+, P2, and C–/– were infected with HSV-1 or VSV, with or without prior stimulation with IFN-α (105 IU/ml) for 24 hours. Viral titers were determined after 48 hours of infection. Each independent experiment is shown in a different color. Vertical lines have been drawn between maximum and minimum values. (C) Schematic representation of cytokine production and cooperation between monocytes/dendritic cells and T/NK cells upon live BCG stimulation. Mutant molecules from patients with MSMD defects compared with our patients are shown in gray. STAT1 and its corresponding pathway are shown in red.
Figure 9
Figure 9. Whole-blood assay on patients’ cells shows a defect of response to IFN-γ.
Cytokine concentrations in the whole-blood supernatant from our cohort of healthy controls (C+/+), patients with complete IL-12B deficiency (cIL-12B), patients with complete IL-12Rβ1 deficiency (cIL-12Rβ1), patients with complete IFN-γR1 deficiency (cIFN-γR1), patients with partial IFN-γR1 deficiency (pIFN-γR1), patients with complete IFN-γR2 deficiency (cIFN-γR2), patients with complete STAT1 deficiency (cSTAT1), patients with partial dominant STAT1 deficiency (pdSTAT1), P1 and P2, and H when not stimulated or stimulated for 48 hours with live BCG alone or supplemented with IL-12 or IFN-γ. The concentrations of IFN-γ and IL-12p70 (pg/ml) in the supernatant were determined by ELISA. Each individual is represented by an open circle, and the median is represented by a thick horizontal bar.
Figure 10
Figure 10. The IL-27 and IFN-λ1 pathways are STAT1 dependent.
(A) IFIT1 mRNA in EBV-B cells from C+/+, P1, and C–/– after stimulation for 1.5, 2, and 2.5 hours with 20 ng/ml IFN-λ1 or no stimulation. Results are normalized with respect to GUS mRNA and are expressed as multiples (fold induction) of the unstimulated value ± SD. *P < 0.05, **P < 0.01 when compared to C+/+ (Supplemental Table 2). The experiment shown is representative of 3 independent experiments. (B) EMSA with nuclear extracts (5 μg) from EBV-B cells from H, C+/+, P1, P2, C+/–, and C–/– not stimulated or stimulated (S) for 30 minutes with 100 ng/ml IL-27. (B and C) Radiolabeled GAS probes were used. For supershift experiments, IL-27–stimulated nuclear extracts from C+/+ were first incubated with antibodies specific for STAT1, STAT2, STAT3, STAT4, the corresponding isotypic antibodies (Iso), or with a non-radiolabeled probe (C). (C) The experiments shown are representative of 2 to 3 independent experiments. Quantification by PhosphoImager SI (Molecular Dynamics), using the GAS probe, of the response to 100 ng/ml IL-27. Each independent experiment is shown in a different color. The responses are expressed as percentages of the positive control response (taken as 100%). (D) Abundance of IRF1 mRNA in EBV-B cells from C+/+, P1, P2, and C–/–. The cells were either not stimulated or stimulated with 100 ng/ml IL-27 for 1 hour. The results are normalized with respect to GUS mRNA and are expressed as multiples (fold induction) of the unstimulated value ± SD. **P < 0.01, ***P < 0.001 when compared to C+/+. The exact P values are reported in Supplemental Table 2. The experiment shown is representative of 2 independent experiments.

Similar articles

Cited by

References

    1. Platanias L.C. Mechanisms of type-I- and type-II-interferon-mediated signalling. Nat. Rev. Immunol. 2005;5:375–386. doi: 10.1038/nri1604. - DOI - PubMed
    1. Schindler C., Levy D.E., Decker T. JAK-STAT signaling: from interferons to cytokines. J. Biol. Chem. 2007;282:20059–20063. doi: 10.1074/jbc.R700016200. - DOI - PubMed
    1. Zakharova N., et al. Distinct transcriptional activation functions of STAT1alpha and STAT1beta on DNA and chromatin templates. J. Biol. Chem. 2003;278:43067–43073. doi: 10.1074/jbc.M308166200. - DOI - PubMed
    1. Alvarez G.R., Zwilling B.S., Lafuse W.P. Mycobacterium avium inhibition of IFN-gamma signaling in mouse macrophages: Toll-like receptor 2 stimulation increases expression of dominant-negative STAT1 beta by mRNA stabilization. J. Immunol. 2003;171:6766–6773. - PubMed
    1. Banninger G., Reich N.C. STAT2 nuclear trafficking. J. Biol. Chem. 2004;279:39199–39206. doi: 10.1074/jbc.M400815200. - DOI - PubMed

Publication types