Probing the multifactorial basis of Plasmodium falciparum quinine resistance: evidence for a strain-specific contribution of the sodium-proton exchanger PfNHE
- PMID: 19428659
- PMCID: PMC3082771
- DOI: 10.1016/j.molbiopara.2009.01.011
Probing the multifactorial basis of Plasmodium falciparum quinine resistance: evidence for a strain-specific contribution of the sodium-proton exchanger PfNHE
Abstract
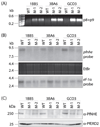
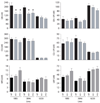
Quinine (QN) continues to be an important treatment option for severe malaria, however resistance to this drug has emerged in field isolates of the etiologic agent Plasmodium falciparum. Quantitative trait loci investigations of QN resistance have mapped three loci of this complex trait. Two coincide with pfcrt and pfmdr1, involved in resistance to chloroquine (CQ) and other quinoline-based antimalarials. A third locus on chromosome 13 contains the sodium-proton exchanger (pfnhe) gene. Previous studies have associated pfnhe polymorphisms with reduced QN sensitivity in culture-adapted field isolates. Here, we provide direct evidence supporting the hypothesis that pfnhe contributes to QN resistance. Using allelic exchange, we reduced pfnhe expression by introducing a truncated 3' untranslated region (UTR) from pfcrt into the endogenous pfnhe 3'UTR. Transfections were performed with 1BB5 and 3BA6 (both CQ- and QN-resistant) as well as GC03 (CQ- and QN-sensitive), all progenies of the HB3xDd2 genetic cross. RNA and protein analyses of the ensuing recombinant clones demonstrated a approximately 50% decrease in pfnhe expression levels. A statistically significant 30% decrease in QN IC(50) values was associated with these decreased expression levels in 1BB5 and 3BA6 but not in GC03. CQ, mefloquine and lumefantrine IC(50) values were unaltered. Cytosolic pH values were similar in all parental lines and recombinant clones. Our observations support a role for pfnhe in QN resistance in a strain-dependent manner, which might be contingent on pre-existing resistance to CQ and/or QN. These data bolster observations that QN resistance is a complex trait requiring the contribution of multiple transporter proteins.
Figures


Similar articles
-
Polymorphisms of the pfmdr1 but not the pfnhe-1 gene is associated with in vitro quinine sensitivity in Thai isolates of Plasmodium falciparum.Malar J. 2012 Jan 5;11:7. doi: 10.1186/1475-2875-11-7. Malar J. 2012. PMID: 22221394 Free PMC article.
-
Differential association of Plasmodium falciparum Na+/H+ exchanger polymorphism and quinine responses in field- and culture-adapted isolates of Plasmodium falciparum.Antimicrob Agents Chemother. 2011 Dec;55(12):5834-41. doi: 10.1128/AAC.00477-11. Epub 2011 Sep 26. Antimicrob Agents Chemother. 2011. PMID: 21947391 Free PMC article.
-
Plasmodium falciparum Na+/H+ exchanger 1 transporter is involved in reduced susceptibility to quinine.Antimicrob Agents Chemother. 2009 May;53(5):1926-30. doi: 10.1128/AAC.01243-08. Epub 2009 Mar 9. Antimicrob Agents Chemother. 2009. PMID: 19273668 Free PMC article.
-
Update on genetic markers of quinine resistance in Plasmodium falciparum.Mol Biochem Parasitol. 2011 Jun;177(2):77-82. doi: 10.1016/j.molbiopara.2011.01.012. Epub 2011 Feb 1. Mol Biochem Parasitol. 2011. PMID: 21295079 Review.
-
Quinoline-resistance reversing agents for the malaria parasite Plasmodium falciparum.Drug Resist Updat. 2006 Aug-Oct;9(4-5):211-26. doi: 10.1016/j.drup.2006.09.002. Epub 2006 Oct 24. Drug Resist Updat. 2006. PMID: 17064951 Review.
Cited by
-
Identification of the drug/metabolite transporter 1 as a marker of quinine resistance in a NF54×Cam3.II P. falciparum genetic cross.bioRxiv [Preprint]. 2024 Oct 1:2024.09.27.615529. doi: 10.1101/2024.09.27.615529. bioRxiv. 2024. PMID: 39386571 Free PMC article. Preprint.
-
The Key Glycolytic Enzyme Phosphofructokinase Is Involved in Resistance to Antiplasmodial Glycosides.mBio. 2020 Dec 8;11(6):e02842-20. doi: 10.1128/mBio.02842-20. mBio. 2020. PMID: 33293381 Free PMC article.
-
Analysis of Plasmodium falciparum Na+/H+ exchanger (pfnhe1) polymorphisms among imported African malaria parasites isolated in Wuhan, Central China.BMC Infect Dis. 2019 Apr 29;19(1):354. doi: 10.1186/s12879-019-3921-7. BMC Infect Dis. 2019. PMID: 31035938 Free PMC article.
-
Amodiaquine resistance in Plasmodium berghei is associated with PbCRT His95Pro mutation, loss of chloroquine, artemisinin and primaquine sensitivity, and high transcript levels of key transporters.Wellcome Open Res. 2017 Jun 20;2:44. doi: 10.12688/wellcomeopenres.11768.2. eCollection 2017. Wellcome Open Res. 2017. PMID: 29946569 Free PMC article.
-
Drug resistance in Plasmodium.Nat Rev Microbiol. 2018 Mar;16(3):156-170. doi: 10.1038/nrmicro.2017.161. Epub 2018 Jan 22. Nat Rev Microbiol. 2018. PMID: 29355852 Free PMC article. Review.
References
-
- Winstanley P. Modern chemotherapeutic options for malaria. Lancet Infect Dis. 2001;1:242–250. - PubMed
-
- Meshnick SR. From quinine to qinghaosu: historical perspectives. In: Sherman I, editor. Malaria: parasite biology, pathogenesis and protection. Washington, DC: ASM Press; 1998. pp. 341–354.
-
- Smith DC. Quinine and fever: The development of the effective dosage. J Hist Med Allied Sci. 1976;31:343–367. - PubMed
-
- Foley M, Tilley L. Quinoline antimalarials: mechanisms of action and resistance and prospects for new agents. Pharmacol Ther. 1998;79:55–87. - PubMed
-
- White NJ. Antimalarial drug resistance: the pace quickens. J Antimicrob Chemother. 1992;30:571–585. - PubMed
Publication types
MeSH terms
Substances
Grants and funding
LinkOut - more resources
Full Text Sources
Molecular Biology Databases

