. 2009 Jun;117(6):613-34.
doi: 10.1007/s00401-009-0538-8. Epub 2009 Apr 28.

Unified staging system for Lewy body disorders: correlation with nigrostriatal degeneration, cognitive impairment and motor dysfunction

Affiliations

Unified staging system for Lewy body disorders: correlation with nigrostriatal degeneration, cognitive impairment and motor dysfunction

Thomas G Beach et al. Acta Neuropathol. 2009 Jun.

Abstract

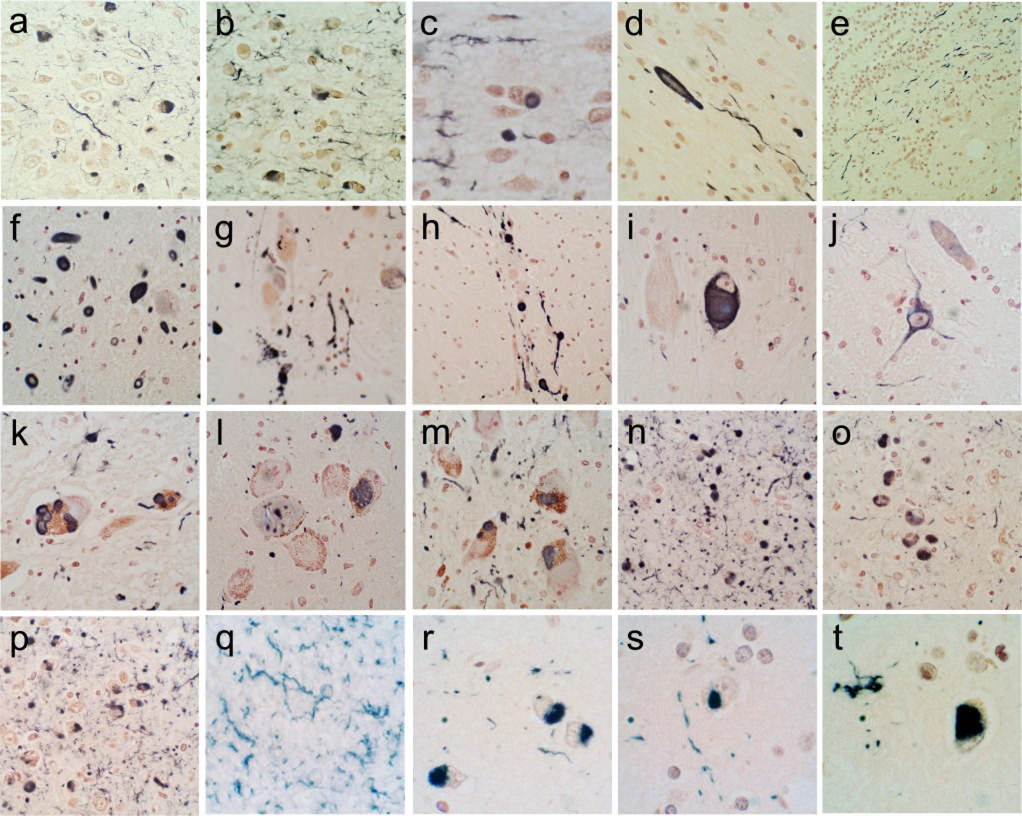
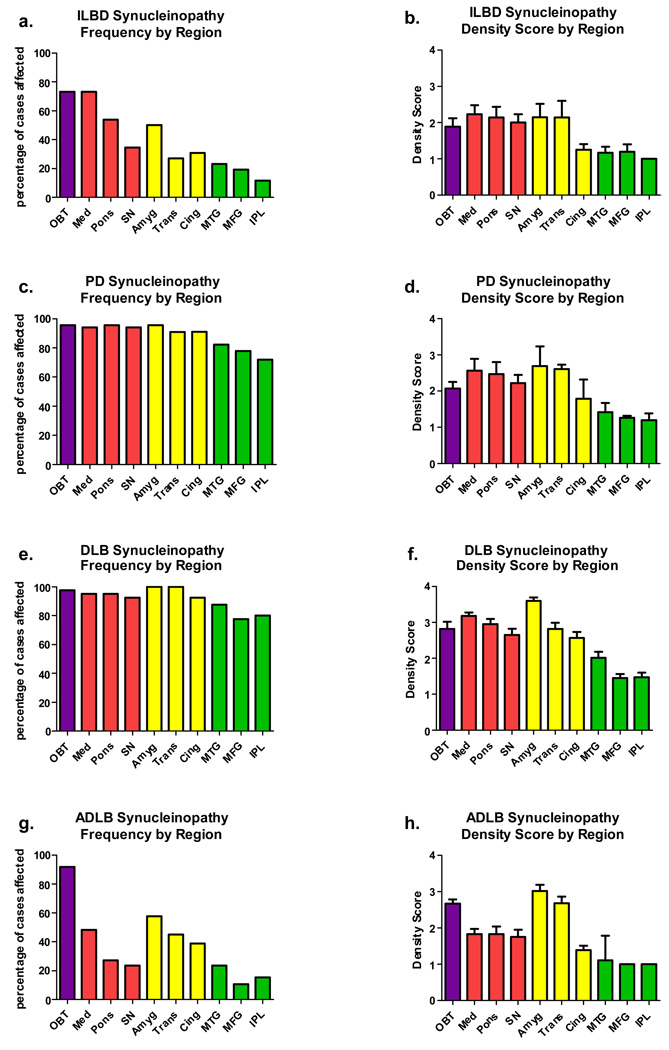
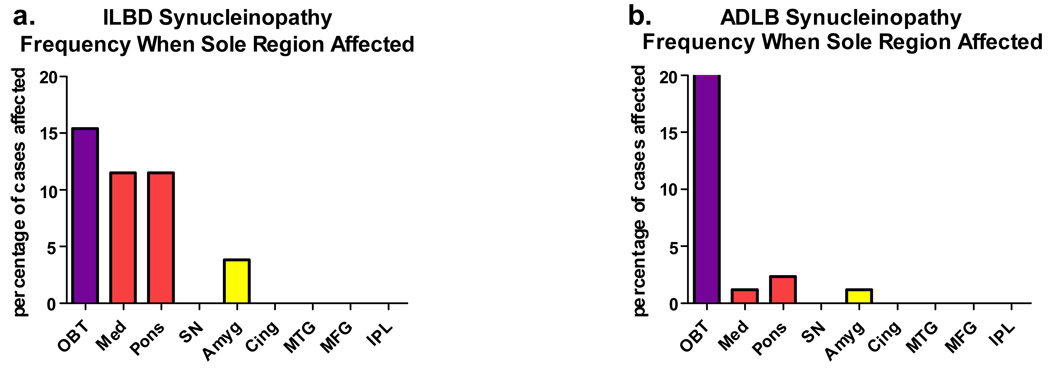
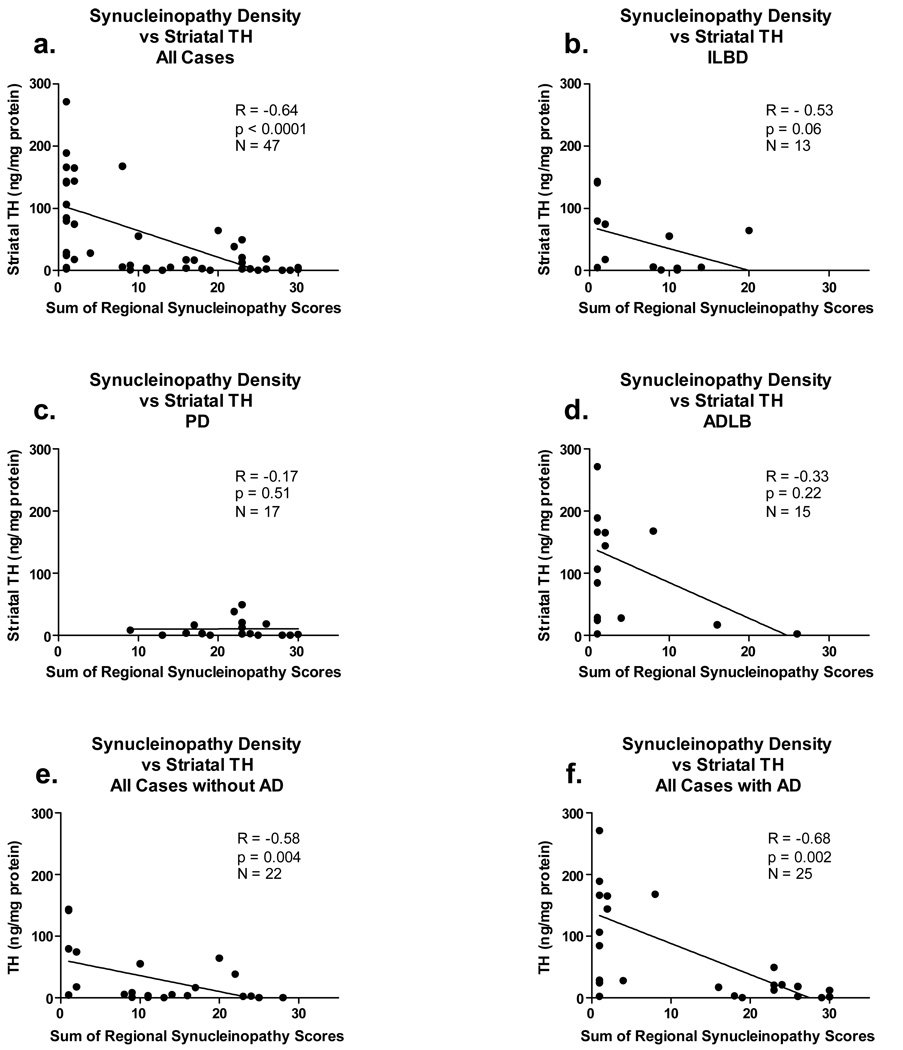
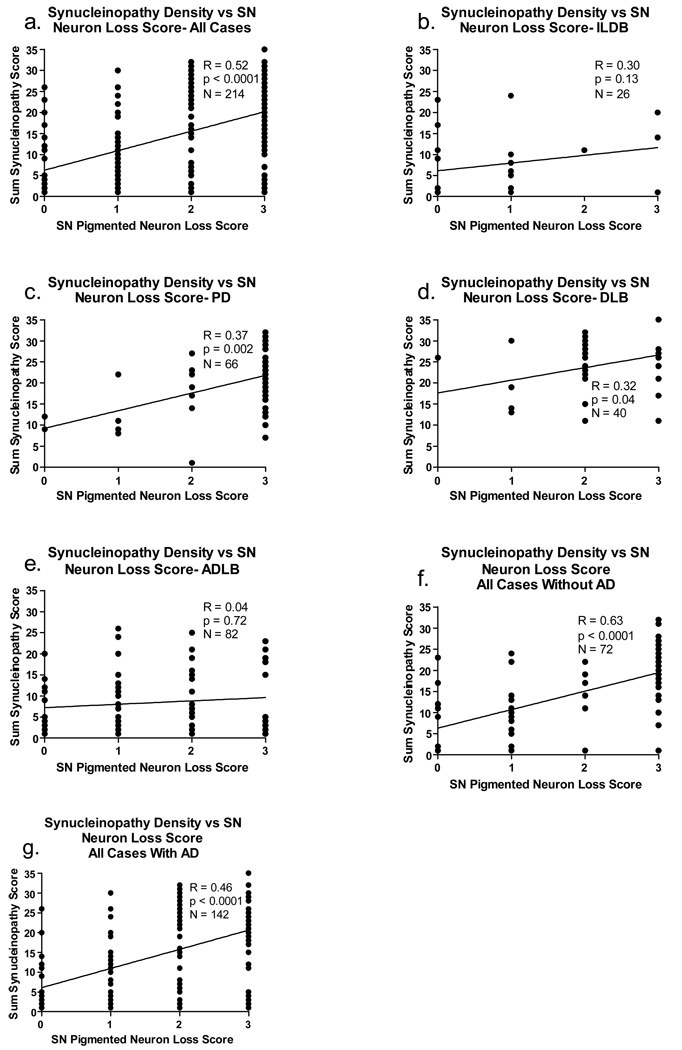
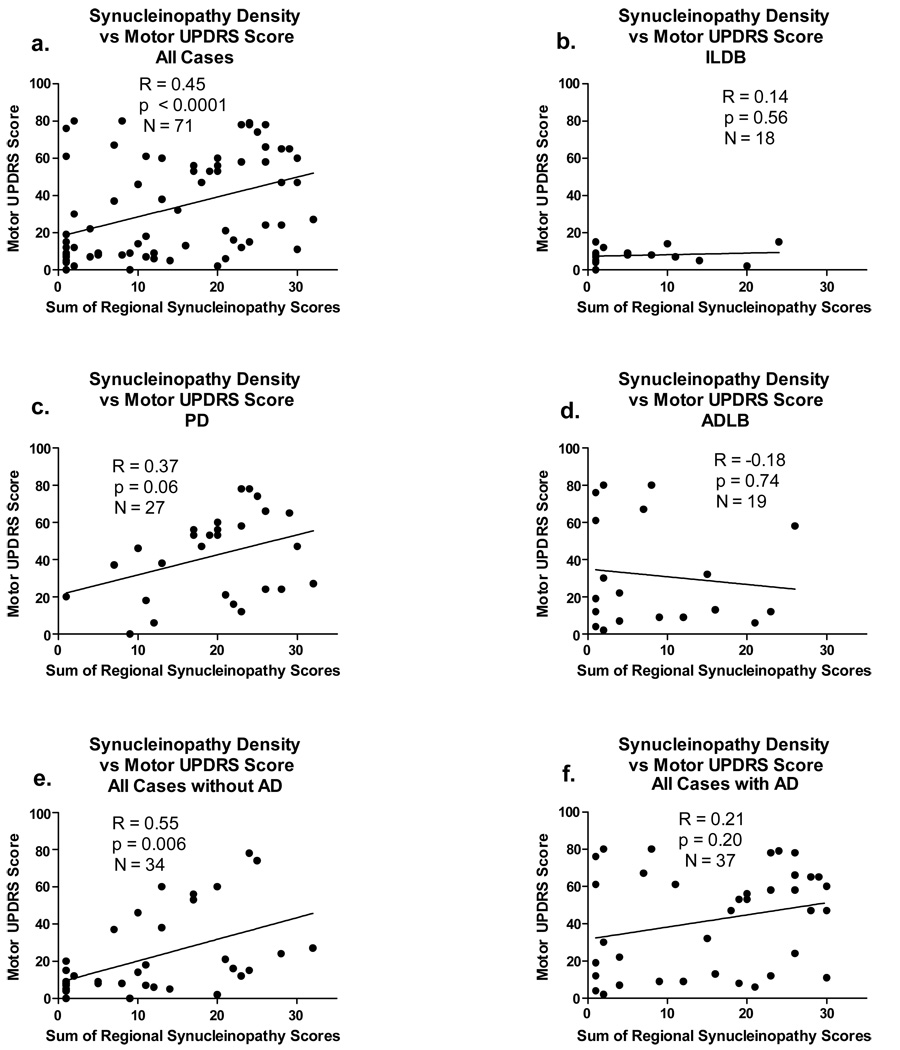
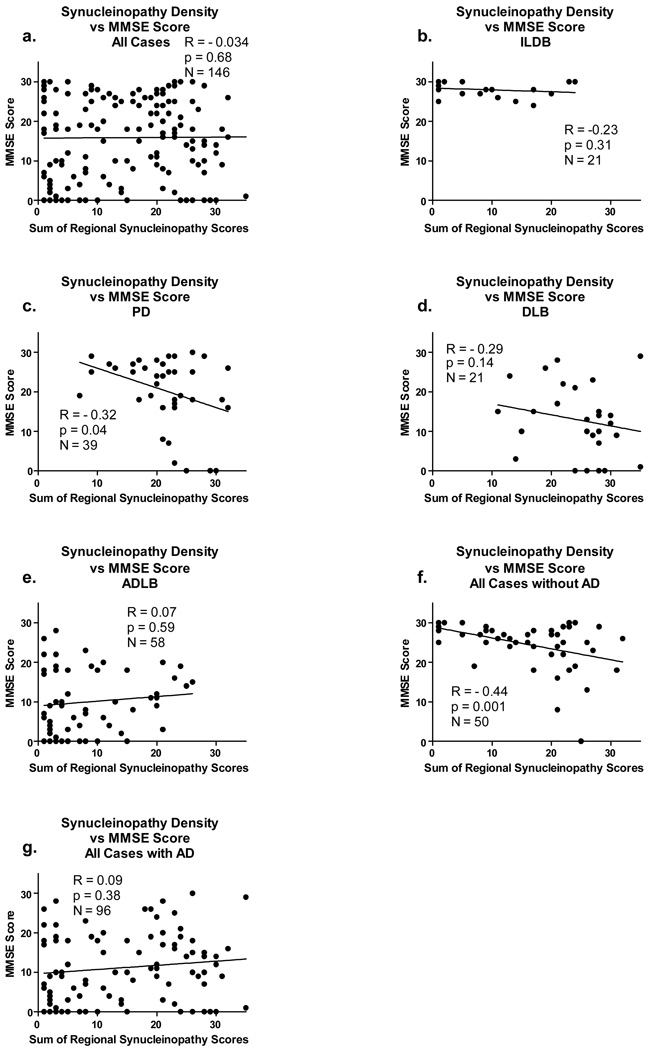
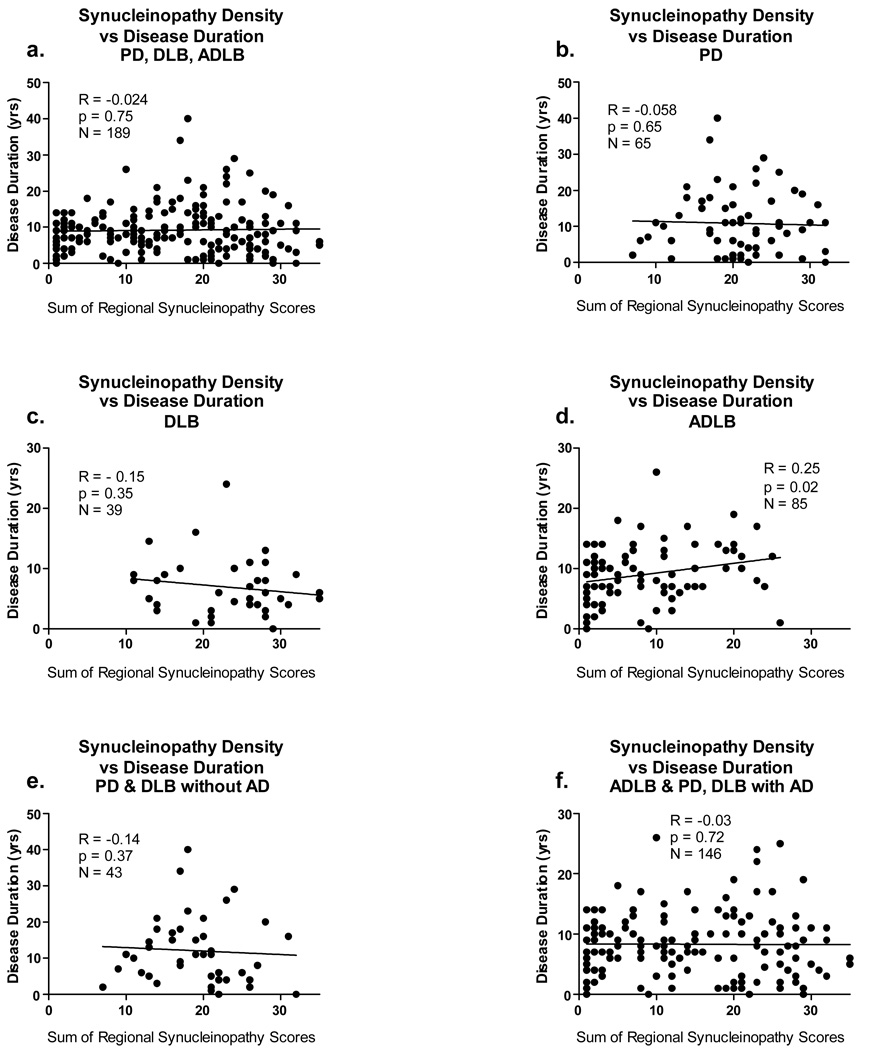
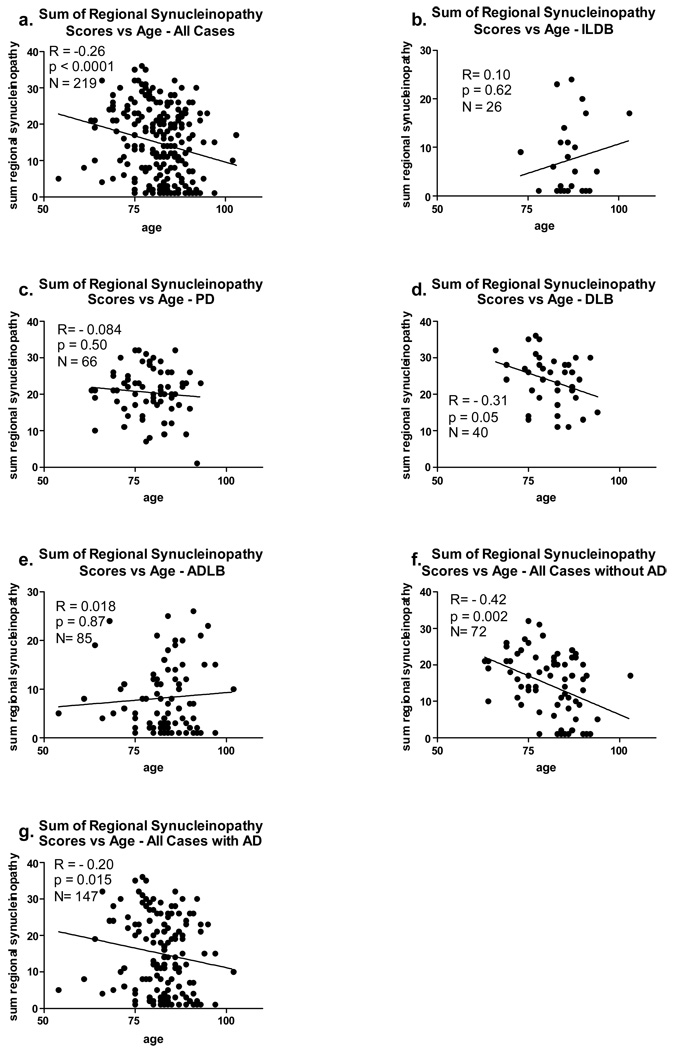
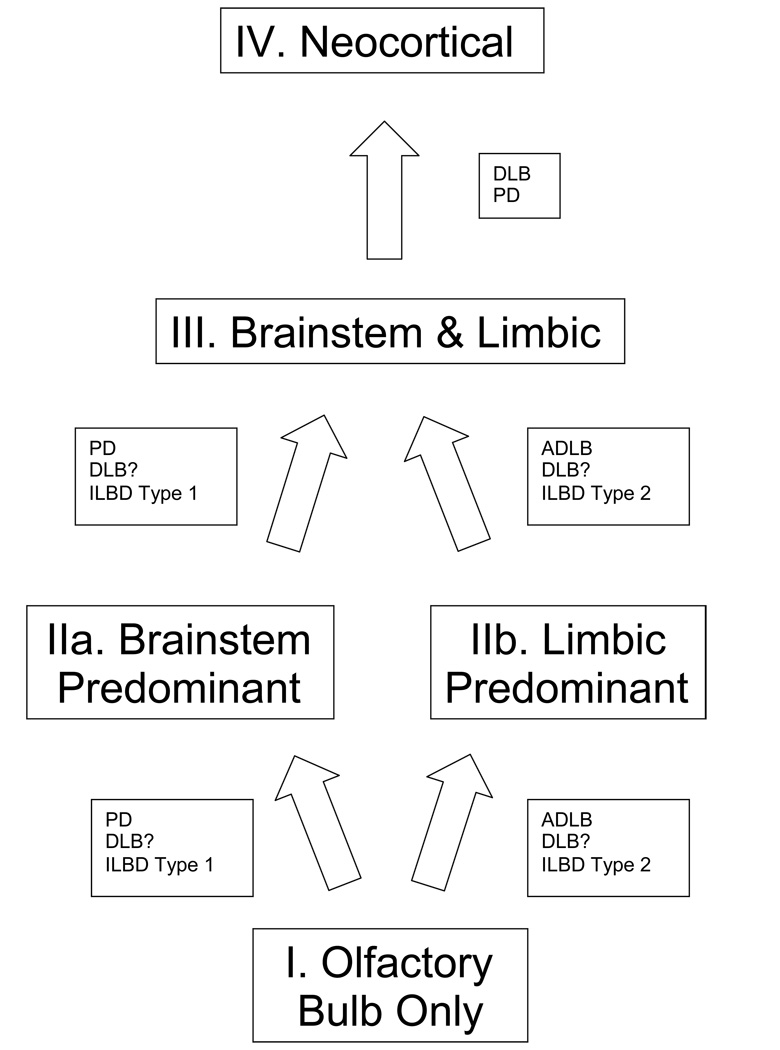
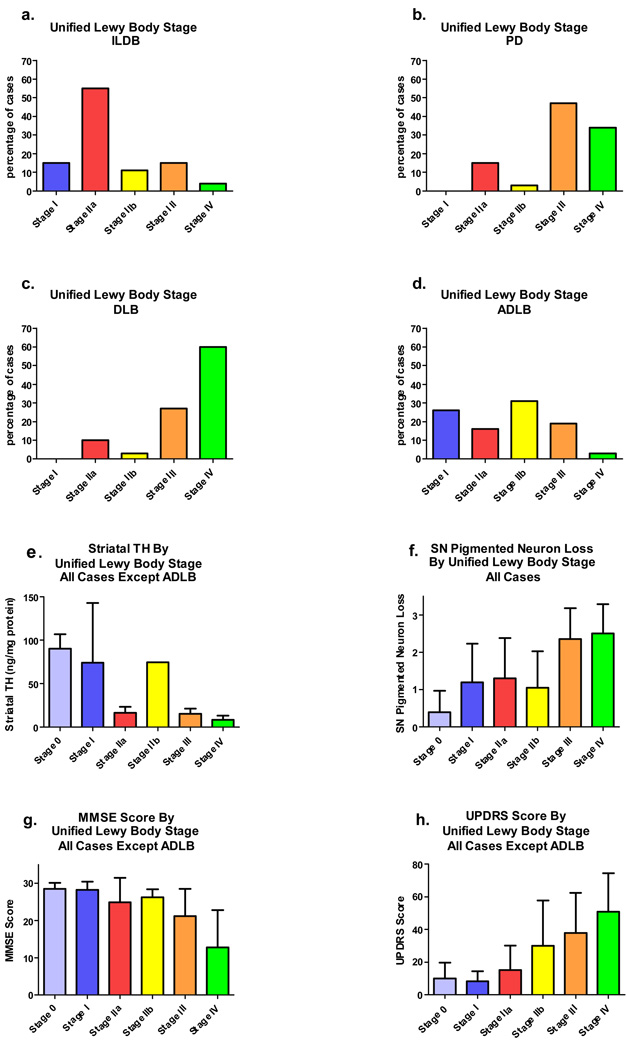
The two current major staging systems in use for Lewy body disorders fail to classify up to 50% of subjects. Both systems do not allow for large numbers of subjects who have Lewy-type alpha-synucleinopathy (LTS) confined to the olfactory bulb or who pass through a limbic-predominant pathway that at least initially bypasses the brainstem. The results of the current study, based on examination of a standard set of ten brain regions from 417 subjects stained immunohistochemically for alpha-synuclein, suggest a new staging system that, in this study, allows for the classification of all subjects with Lewy body disorders. The autopsied subjects included elderly subjects with Parkinson's disease, dementia with Lewy bodies, incidental Lewy body disease and Alzheimer's disease with Lewy bodies, as well as comparison groups without Lewy bodies. All subjects were classifiable into one of the following stages: I. Olfactory Bulb Only; IIa Brainstem Predominant; IIb Limbic Predominant; III Brainstem and Limbic; IV Neocortical. Progression of subjects through these stages was accompanied by a generally stepwise worsening in terms of striatal tyrosine hydroxylase concentration, substantia nigra pigmented neuron loss score, Mini Mental State Examination score and score on the Unified Parkinson's Disease Rating Scale Part 3. Additionally, there were significant correlations between these measures and LTS density scores. It is suggested that the proposed staging system would improve on its predecessors by allowing classification of a much greater proportion of cases.


Figures

Figure 1
Figure 1
Photomicrographs depicting immunohistochemical staining for α-synuclein in the brain regions investigated. Positive immunostaining is black; the counterstain is Neutral Red. (a–e) The olfactory bulb and tract. The anterior olfactory nucleus of the olfactory bulb is shown in a–c; both neuronal perikaryal inclusions as well as fibers are present. An enlarged, abnormal neurite within the olfactory tract is shown in d. Positive fibers coursing in parallel array through the internal plexiform layer are shown in e. (f–j) The anterior medulla. The dorsal motor nucleus of the vagus nerve is shown in f, the raphe nucleus in g and i, the internal tract of the IXth nerve in h and the lateral reticular nucleus in j. (k–m) The locus ceruleus in the pons. (n–p) The amgydala. (q) The cingulate gyrus. (r) The middle temporal gyrus. (s) The middle frontal gyrus. (t) The inferior parietal lobule.
Figure 2
Figure 2
Graphic depiction of Lewy-type synucleinopathy frequency (a,c,e,g) and density (b,d,f,h) by brain region. Purple bars are for olfactory bulb, red are for brainstem regions, yellow are for limbic regions and green are for neocortical regions. Error bars are standard error of the mean. Mean density scores differed significantly between regions for all diagnostic groups shown (p < 0.001). Abbreviations: OBT = olfactory bulb and tract; Med = medulla; SN = substantia nigra; Amyg = amygdala; Trans = transentorhinal cortex; Cing = cingulate gyrus; MTG = middle temporal gyrus; MFG = middle frontal gyrus; IPL = inferior parietal lobule.
Figure 3
Figure 3
Graphic depiction of the frequency with which brain regions were the sole region affected by Lewy-type synucleinopathy. (a) For ILBD subjects. (b) For ADLB subjects.
Figure 4
Figure 4
Graphs depicting correlations between the sum of brain regional synucleinopathy density scores and measures of striatal tyrosine hydroxylase (TH), in subjects divided or not divided by diagnostic group and presence or absence of AD. As there were only two DLB subjects with TH measurements available, there is no graph for this category, but the two subjects are included in graphs a and f. The graph titled “All Cases” included all subjects with Lewy body pathology and TH measurements available, regardless of diagnosis. The graph titled “with AD” included data from all subjects who also met NIA-Reagan “intermediate” or “high” criteria for AD, regardless of their other diagnoses. The graph titled “without AD” included data from all subjects who did not meet NIA-Reagan “intermediate” or “high” criteria for AD, regardless of their other diagnoses. R = Spearman Rho; N = number of subjects included in the analysis; p = probability. Abbreviations otherwise as for Figure 2.
Figure 5
Figure 5
Graphs depicting correlations between the sum of brain regional synucleinopathy density scores and substantia nigra (SN) pigmented neuron loss score, in subjects divided or not divided by diagnostic group and presence or absence of AD. The graph titled “All Cases” included all subjects with Lewy body pathology regardless of diagnosis. The graph titled “with AD” included data from all subjects who also met NIA-Reagan “intermediate” or “high” criteria for AD, regardless of their other diagnoses. The graph titled “without AD” included data from all subjects who did not meet NIA-Reagan “intermediate” or “high” criteria for AD, regardless of their other diagnoses. R = Spearman Rho; N = number of subjects included in the analysis; p = probability. Abbreviations otherwise as for Figure 2.
Figure 6
Figure 6
Graphs depicting correlations between the sum of brain regional synucleinopathy density scores and motor scores on the Unified Parkinson’s Disease Rating Scale (UPDRS), in subjects divided or not divided by diagnostic group and presence or absence of AD. As there were too few DLB subjects with UPDRS scores available, there is no graph for this category, but these subjects are included in graphs a, e and f. The graph titled “All Cases” included all subjects with Lewy body pathology regardless of diagnosis. The graph titled “with AD” included data from all subjects who also met NIA-Reagan “intermediate” or “high” criteria for AD, regardless of their other diagnoses. The graph titled “without AD” included data from all subjects who did not meet NIA-Reagan “intermediate” or “high” criteria for AD, regardless of their other diagnoses. R = Spearman Rho; N = number of subjects included in the analysis; p = probability. Abbreviations otherwise as for Figure 2.
Figure 7
Figure 7
Graphs depicting correlations between the sum of brain regional synucleinopathy density scores and scores on the Mini Mental State Examination (MMSE), in subjects divided or not divided by diagnostic group and presence or absence of AD. The graph titled “All Cases” included all subjects with Lewy body pathology regardless of diagnosis. The graph titled “with AD” included data from all subjects who also met NIA-Reagan “intermediate” or “high” criteria for AD, regardless of their other diagnoses. The graph titled “without AD” included data from all subjects who did not meet NIA-Reagan “intermediate” or “high” criteria for AD, regardless of their other diagnoses. R = Spearman Rho; N = number of subjects included in the analysis; p = probability. Abbreviations otherwise as for Figure 2.
Figure 8
Figure 8
Graphs depicting correlations between the sum of brain regional synucleinopathy density scores and disease duration, in subjects divided or not divided by diagnostic group and presence or absence of AD. The graph titled “with AD” included data from all subjects who also met NIA-Reagan “intermediate” or “high” criteria for AD, regardless of their other diagnoses. The graph titled “without AD” included data from all subjects who did not meet NIA-Reagan “intermediate” or “high” criteria for AD, regardless of their other diagnoses. R = Spearman Rho; N = number of subjects included in the analysis; p = probability. Abbreviations otherwise as for Figure 2.
Figure 9
Figure 9
Graphic depiction of the relationship between age and the sum of regional synucleinopathy densities, in subjects divided or not divided by diagnostic group and presence or absence of AD. The graph titled “with AD” included data from all subjects who also met NIA-Reagan “intermediate” or “high” criteria for AD, regardless of their other diagnoses. The graph titled “without AD” included data from all subjects who did not meet NIA-Reagan “intermediate” or “high” criteria for AD, regardless of their other diagnoses. R = Spearman Rho; N = number of subjects included in the analysis; p = probability. Abbreviations otherwise as for Figure 2.
Figure 10
Figure 10
Schematic depiction of hypothetical progression pathways and stages for Lewy body disorders. The pathway for PD seems likely to proceed through Stage IIa (brainstem predominant) while that for ADLB passes through Stage IIb. The pathway followed by DLB is uncertain as the current definition of DLB largely excludes all but the neocortical stage. There may be two types of ILBD, one that leads to PD and another that leads to ADLB and possibly DLB. Only PD and DLB progress to the neocortical stage.
Figure 11
Figure 11
Graphic depiction of differential characteristics of the subjects classified by the proposed unified Lewy body staging system. For all graphs, the 0 stage data is from the normal control group. a) Incidental Lewy body disease (ILBD) subjects classified by Unified Lewy body stage. b) Parkinson’s disease (PD) subjects classified by Unified Lewy body stage. c) Dementia with Lewy bodies (DLB) subjects classified by Unified Lewy body stage. e) Unified Lewy body stage by striatal TH concentration. Subjects with ADLB were excluded from the analysis. Error bars show standard error of the mean. The means of the stages differed significantly (p < 0.001). f) Unified Lewy body stage by substantia nigra pigmented neuron loss score. All subjects with Lewy body pathology were included. Error bars indicate standard deviation. The means of the stages differed significantly (p < 0.001).

Similar articles

Cited by

References

    1. Consensus recommendations for the postmortem diagnosis of Alzheimer's disease. The National Institute on Aging, and Reagan Institute Working Group on Diagnostic Criteria for the Neuropathological Assessment of Alzheimer's Disease. Neurobiol Aging. 1997;18:S1–S2. - PubMed
    1. Adler CH. Nonmotor complications in Parkinson's disease. Mov Disord. 2005;20 Suppl 11:S23–S29. - PubMed
    1. Alafuzoff I, Parkkinen L, Al-Sarraj S, Arzberger T, Bell J, Bodi I, Bogdanovic N, Budka H, Ferrer I, Gelpi E, Gentleman S, Giaccone G, Kamphorst W, King A, Korkolopoulou P, Kovacs GG, Larionov S, Meyronet D, Monoranu C, Morris J, Parchi P, Patsouris E, Roggendorf W, Seilhean D, Streichenberger N, Thal DR, Kretzschmar H. Assessment of alpha-synuclein pathology: a study of the BrainNet Europe Consortium. J Neuropathol Exp Neurol. 2008;67:125–143. - PubMed
    1. Baba M, Nakajo S, Tu PH, Tomita T, Nakaya K, Lee VM, Trojanowski JQ, Iwatsubo T. Aggregation of alpha-synuclein in Lewy bodies of sporadic Parkinson's disease and dementia with Lewy bodies. Am J Pathol. 1998;152:879–884. - PMC - PubMed
    1. Beach TG, Adler CH, Sue LI, Peirce JB, Bachalakuri J, Dalsing-Hernandez JE, Lue LF, Caviness JN, Connor DJ, Sabbagh MN, Walker DG. Reduced striatal tyrosine hydroxylase in incidental Lewy body disease. Acta Neuropathol. 2008;115:445–451. - PMC - PubMed

Publication types

MeSH terms