. 2009 Jun 18;113(25):6351-60.
doi: 10.1182/blood-2009-02-206557. Epub 2009 Apr 23.

Antigen sensitivity is a major determinant of CD8+ T-cell polyfunctionality and HIV-suppressive activity

Affiliations

Antigen sensitivity is a major determinant of CD8+ T-cell polyfunctionality and HIV-suppressive activity

Jorge R Almeida et al. Blood. .

Abstract

CD8(+) T cells are major players in the immune response against HIV. However, recent failures in the development of T cell-based vaccines against HIV-1 have emphasized the need to reassess our basic knowledge of T cell-mediated efficacy. CD8(+) T cells from HIV-1-infected patients with slow disease progression exhibit potent polyfunctionality and HIV-suppressive activity, yet the factors that unify these properties are incompletely understood. We performed a detailed study of the interplay between T-cell functional attributes using a bank of HIV-specific CD8(+) T-cell clones isolated in vitro; this approach enabled us to overcome inherent difficulties related to the in vivo heterogeneity of T-cell populations and address the underlying determinants that synthesize the qualities required for antiviral efficacy. Conclusions were supported by ex vivo analysis of HIV-specific CD8(+) T cells from infected donors. We report that attributes of CD8(+) T-cell efficacy against HIV are linked at the level of antigen sensitivity. Highly sensitive CD8(+) T cells display polyfunctional profiles and potent HIV-suppressive activity. These data provide new insights into the mechanisms underlying CD8(+) T-cell efficacy against HIV, and indicate that vaccine strategies should focus on the induction of HIV-specific T cells with high levels of antigen sensitivity to elicit potent antiviral efficacy.


Figures

Figure 1
Figure 1
Identification of HIV-specific CD8+ T-cell clones with distinct antigen sensitivities. (A) Half-maximal effective concentrations (EC50) of HLA B*2705-restricted KK10-specific CD8+ T-cell clones were determined in standard chromium release assays using peptide titrations and a common antigen-presenting HLA B*2705+ B-cell line. The tested CD8+ T-cell clones are classified according to increasing antigen sensitivity from bottom to top. TCRBV usage, CDR3 amino acid sequence, and TCRBJ usage are shown for each clone (ND, not done). Same colors indicate identical clonotypes. The clone reference is indicated on the y-axis (the code last letter corresponds to the patient from which the clone was obtained: A and F for patient 1, B and G for patient 2, and C and H for patient 3). (B) Representative flow cytometric data showing combined αCD8 mAb and KK10/HLA B*2705 tetramer staining of KK10-specific CD8+ T-cell clones with higher or lower levels of antigen sensitivity; staining of a HLA A*0201-restricted CMV pp65-specific clone is shown for comparison. (C) Representative intracellular stainings for perforin and granzyme B in the same CD8+ T-cell clones.
Figure 2
Figure 2
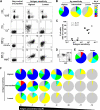
Functional characterization of HIV-specific CD8+ T-cell clones with distinct antigen sensitivities. (A) Representative data showing the simultaneous and independent measurement of 5 separate functions in KK10-specific CD8+ T-cell clones using 8-color flow cytometry. Cells were stimulated for 6 hours in the presence of EBV-transformed HLA B*2705+ B cells and 10−8 M peptide before intracellular staining. Function plots are gated on CD8+ViViD cells; percentages of cells in the different quadrants, gated with respect to the corresponding negative controls (displayed for reference in the left panels for the clone with low antigen sensitivity), are shown. (B) The pie charts depict the background-adjusted polyfunctional profile of 3 representative KK10-specific CD8+ T-cell clones with different antigen sensitivities (highest, C2A; intermediate, H10G; lowest, D8B). For simplicity, responses are grouped according to the number of functions (from CD107a, IFN-γ, TNF-α, IL-2, and MIP-1β) elicited in response to antigen encounter; individual segments represent the proportions of cells within each total clonal population that exhibited the number of functions indicated. (C) Polyfunctionality, defined as the percentage of cells displaying 3 or more functions simultaneously, is plotted as a function of antigen sensitivity. Each dot represents a distinct clone; dots framed by a square or hexagon indicate clones with identical TCRB sequences. The correlation was determined using Spearman rank test. (D) Representative staining for p24 and CD4 from primary CD4+ T cells 3 days postinfection with the replicative HIV-1 strain NL4.3 pseudotyped with vesicular stomatitis virus. (E) Polyfunctional profile of 2 CD8+ T-cell clones with different antigen sensitivity for KK10 (higher, C2A; lower, H8B) after 6-hour incubation with HLA-B27 primary CD4+ T cells infected with HIV-1 (1:10 CD8 to CD4 ratio). (F) Polyfunctional profiling of 3 representative KK10-specific CD8+ T-cell clones (highest, C2A; intermediate, H10G; lowest, D8B) along a peptide concentration gradient.
Figure 3
Figure 3
Ex vivo polyfunctional profiles of HIV-specific CD8+ T-cell populations. Polyfunctional profiling of representative HLA B*2705-restricted KK10 (A)– or HLA A*0301-restricted RY10 (B)–specific CD8+ T-cell populations (from 2 patients of 5 in each case) with different antigen sensitivities along a peptide concentration gradient. Antigen sensitivity of these populations was determined in standard intracellular cytokine-staining assays for IFN-γ secretion conducted directly ex vivo.
Figure 4
Figure 4
Sequential induction of functions with increasing antigen concentration. (A) Representative example of the assessment of individual functions for a KK10-specific CD8+ T-cell clone (G11C) upon activation with a gradient of peptide concentration. Cells are gated on CD8+ViViD. (B) The MFI values for CD107a, IFN-γ, TNF-α, and MIP-1β are plotted for distinct KK10-specific CD8+ T-cell clones ordered according to their antigen sensitivity. Cells were stimulated with 10−6 M cognate peptide in the presence of antigen-presenting EBV-transformed HLA B*2705+ B cells; MFI values were determined after gating solely on cells that were positive for the relevant function, excluding responses less than 20% of the total clonal population in each case. (C) Representative peptide titration assays for the induction of individual functions in a KK10-specific CD8+ T-cell clone (G11C). (D) EC50 values for each individual function obtained with different KK10-specific CD8+ T-cell clones are plotted to highlight the sequential induction of separate functions with antigen concentration. Horizontal bars indicate median values; ○ represent clones with lower levels of antigen sensitivity. *P < .05, **P < .01 calculated using the Wilcoxon signed rank test.
Figure 5
Figure 5
Polyfunctional profiling of HIV-specific CD4+ T-cell clones. (A) Representative data showing the simultaneous and independent measurement of 5 separate functions in a CD4+ T-cell clone specific for HIV-1 Gag. Cells were stimulated for 6 hours in the presence of autologous EBV-transformed B cells and cognate peptide before intracellular staining; αCD107 mAb was added to the assays immediately before stimulation. Function plots are gated on CD3+CD4+ViViD cells; percentages of cells in the different quadrants, gated with respect to the corresponding negative controls, are shown. (B) Representative peptide titration assays for the induction of individual functions in a CD4+ T-cell clone specific for HIV-1 Gag. (C) Polyfunctional profiles of HIV-1 Gag-specific CD4+ T-cell clones with lower or higher levels of antigen sensitivity along a peptide concentration gradient. Antigen sensitivity was determined in CD40L up-regulation assays with immortalized autologous B cells as targets. For simplicity, responses are grouped according to the number of functions (from CD107a, IFN-γ, TNF-α, IL-2, and MIP-1β) elicited in response to antigen encounter; individual segments of the pie charts represent the proportions of cells within each total population that exhibited the number of functions indicated.
Figure 6
Figure 6
Suppression of HIV-1 infection in vitro by HIV-specific CD8+ T-cell clones. (A) Primary CD4+ T cells isolated from a HLA B*2705+ healthy donor and blasted with PHA were infected with the replicative HIV-1 strain NL4.3 (MOI = 10−1.8) in the presence or absence of KK10-specific CD8+ T-cell clones with distinct levels of antigen sensitivity (highest, C2A; intermediate, H10G; lowest, D8B) or a control NV9-specific CD8+ T-cell clone; E:T ratio 1:10. After 3 days, HIV-1 infection levels were measured using intracellular p24 staining. Numbers show the percentages of p24+ cells in the cultures. (B) Inverse correlation between CD8+ T-cell antigen sensitivity and HIV-1 infection in vitro (% of p24+ cells) determined using Spearman rank test (each dot represents 1 clone). (C) Assessment of suppressive activity (fold decrease of p24+ cells compared with infected CD4+ T-cell controls in the absence of CD8+ T cells) for CD8+ T-cell clones at different E:T ratios. (D) Measurement of p24+ cells at decreasing MOI (10−1.8, 10−2.2, 10−3.3) and different E:T ratios for CD8+ T-cell clones with highest (●), intermediate (□), or lowest (◇) levels of antigen sensitivity. CD8neg cells were gated for the analyses. (E) Plasma viral loads and CD4 counts in 21 untreated HIV-infected donors grouped according to the antigen sensitivity (lower ● or higher ○) of their individual immunodominant CD8+ T-cell response, determined in peptide titration IFN-γ ELISPOT assays conducted ex vivo. Immunodominant responses (including HLA-A2 Nef PL10, A3 Gag RY10, A3 Nef QK10, A24 RW8, A26 Gag EL9, B7 Gag GL9, B7 Nef TL10, B8 Gag GI9, B8 Nef FL8, B8 Gag DL10, B27 Gag KK10, and B51 Env RL9) were screened using a panel of 49 optimized cytotoxic T lymphocyte epitopes.

Similar articles

Cited by

References

    1. McMichael A, Hanke T. The quest for an AIDS vaccine: is the CD8+ T-cell approach feasible? Nat Rev Immunol. 2002;2:283–291. - PubMed
    1. Steinbrook R. One step forward, two steps back—will there ever be an AIDS vaccine? N Engl J Med. 2007;357:2653–2655. - PubMed
    1. Sekaly RP. The failed HIV Merck vaccine study: a step back or a launching point for future vaccine development? J Exp Med. 2008;205:7–12. - PMC - PubMed
    1. Watkins DI, Burton DR, Kallas EG, Moore JP, Koff WC. Nonhuman primate models and the failure of the Merck HIV-1 vaccine in humans. Nat Med. 2008;14:617–621. - PMC - PubMed
    1. Betts MR, Nason MC, West SM, et al. HIV nonprogressors preferentially maintain highly functional HIV-specific CD8+ T cells. Blood. 2006;107:4781–4789. - PMC - PubMed

Publication types