

Pre-micro RNA signatures delineate stages of endothelial cell transformation in Kaposi sarcoma
- PMID: 19381257
- PMCID: PMC2663814
- DOI: 10.1371/journal.ppat.1000389
Pre-micro RNA signatures delineate stages of endothelial cell transformation in Kaposi sarcoma
Abstract
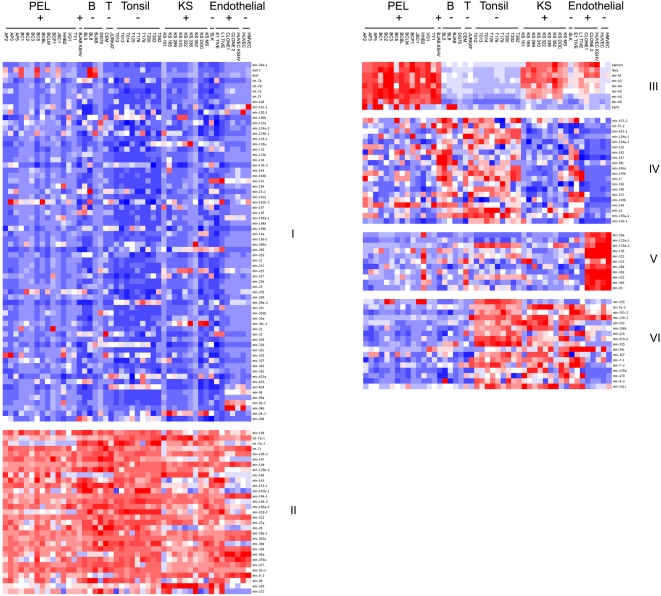
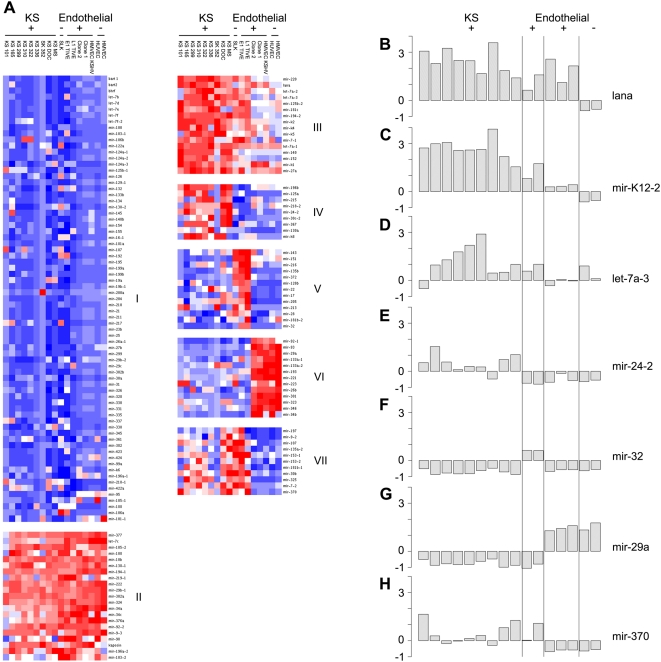
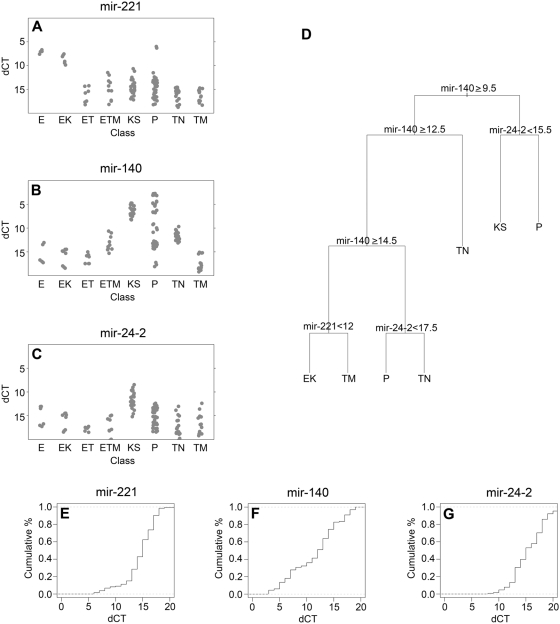
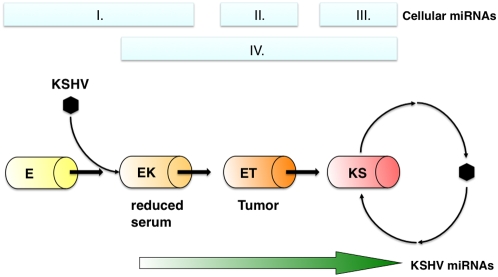
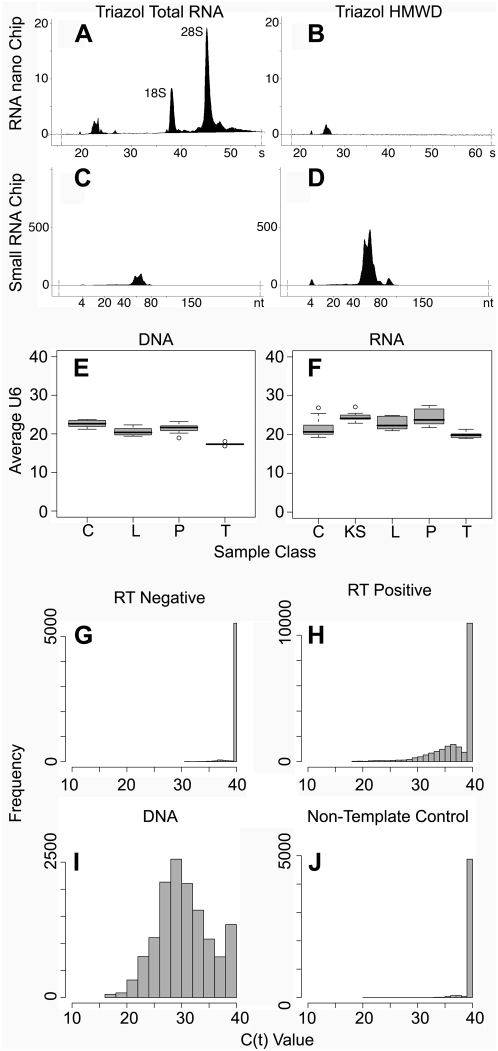
MicroRNAs (miRNA) have emerged as key regulators of cell lineage differentiation and cancer. We used precursor miRNA profiling by a novel real-time QPCR method (i) to define progressive stages of endothelial cell transformation cumulating in Kaposi sarcoma (KS) and (ii) to identify specific miRNAs that serve as biomarkers for tumor progression. We were able to compare primary patient biopsies to well-established culture and mouse tumor models. Loss of mir-221 and gain of mir-15 expression demarked the transition from merely immortalized to fully tumorigenic endothelial cells. Mir-140 and Kaposi sarcoma-associated herpesvirus viral miRNAs increased linearly with the degree of transformation. Mir-24 emerged as a biomarker specific for KS.
Conflict of interest statement
The authors have declared that no competing interests exist.
Figures
Similar articles
-
The manipulation of miRNA-gene regulatory networks by KSHV induces endothelial cell motility.Blood. 2011 Sep 8;118(10):2896-905. doi: 10.1182/blood-2011-01-330589. Epub 2011 Jun 28. Blood. 2011. PMID: 21715310
-
Modified Cross-Linking, Ligation, and Sequencing of Hybrids (qCLASH) Identifies Kaposi's Sarcoma-Associated Herpesvirus MicroRNA Targets in Endothelial Cells.J Virol. 2018 Mar 28;92(8):e02138-17. doi: 10.1128/JVI.02138-17. Print 2018 Apr 15. J Virol. 2018. PMID: 29386283 Free PMC article.
-
Tumor suppressor microRNAs are underrepresented in primary effusion lymphoma and Kaposi sarcoma.Blood. 2009 Jun 4;113(23):5938-41. doi: 10.1182/blood-2008-09-179168. Epub 2009 Feb 27. Blood. 2009. PMID: 19252139 Free PMC article.
-
The role of Kaposi sarcoma-associated herpesvirus in the pathogenesis of Kaposi sarcoma.J Pathol. 2015 Jan;235(2):368-80. doi: 10.1002/path.4441. J Pathol. 2015. PMID: 25212381 Review.
-
Manipulation of endothelial cells by KSHV: implications for angiogenesis and aberrant vascular differentiation.Semin Cancer Biol. 2014 Jun;26:69-77. doi: 10.1016/j.semcancer.2014.01.008. Epub 2014 Jan 28. Semin Cancer Biol. 2014. PMID: 24486643 Review.
Cited by
-
MicroRNAs in soft tissue sarcomas: overview of the accumulating evidence and importance as novel biomarkers.Biomed Res Int. 2014;2014:592868. doi: 10.1155/2014/592868. Epub 2014 Aug 4. Biomed Res Int. 2014. PMID: 25165708 Free PMC article. Review.
-
Kaposi's Sarcoma-Associated Herpesvirus (KSHV) Induces the Oncogenic miR-17-92 Cluster and Down-Regulates TGF-β Signaling.PLoS Pathog. 2015 Nov 6;11(11):e1005255. doi: 10.1371/journal.ppat.1005255. eCollection 2015. PLoS Pathog. 2015. PMID: 26545119 Free PMC article.
-
Viral effects on the content and function of extracellular vesicles.Nat Rev Microbiol. 2017 Sep;15(9):559-572. doi: 10.1038/nrmicro.2017.60. Epub 2017 Jun 26. Nat Rev Microbiol. 2017. PMID: 28649136 Free PMC article. Review.
-
Regulation of NF-kappaB inhibitor IkappaBalpha and viral replication by a KSHV microRNA.Nat Cell Biol. 2010 Feb;12(2):193-9. doi: 10.1038/ncb2019. Epub 2010 Jan 17. Nat Cell Biol. 2010. PMID: 20081837 Free PMC article.
-
DLX1008 (brolucizumab), a single-chain anti-VEGF-A antibody fragment with low picomolar affinity, leads to tumor involution in an in vivo model of Kaposi Sarcoma.PLoS One. 2020 May 14;15(5):e0233116. doi: 10.1371/journal.pone.0233116. eCollection 2020. PLoS One. 2020. PMID: 32407363 Free PMC article.
References
-
- El Amari EB, Toutous-Trellu L, Gayet-Ageron A, Baumann M, Cathomas G, et al. Predicting the evolution of Kaposi sarcoma, in the highly active antiretroviral therapy era. Aids. 2008;22:1019–1028. - PubMed
Publication types
MeSH terms
Substances
Grants and funding
- R01 CA109232/CA/NCI NIH HHS/United States
- DE018304/DE/NIDCR NIH HHS/United States
- R01 DE018304-03/DE/NIDCR NIH HHS/United States
- CA 096500/CA/NCI NIH HHS/United States
- CA096500/CA/NCI NIH HHS/United States
- R01 DE018304/DE/NIDCR NIH HHS/United States
- CA109232/CA/NCI NIH HHS/United States
- R01 CA109232-05/CA/NCI NIH HHS/United States
- HL 083469/HL/NHLBI NIH HHS/United States
- R01 CA096500/CA/NCI NIH HHS/United States
- T32 AI00741/AI/NIAID NIH HHS/United States
- R01 DE018304-02/DE/NIDCR NIH HHS/United States
- R01 HL083469/HL/NHLBI NIH HHS/United States
- R01 DE018304-01/DE/NIDCR NIH HHS/United States
LinkOut - more resources
Full Text Sources
Other Literature Sources
Medical
