Consuming fructose-sweetened, not glucose-sweetened, beverages increases visceral adiposity and lipids and decreases insulin sensitivity in overweight/obese humans
- PMID: 19381015
- PMCID: PMC2673878
- DOI: 10.1172/JCI37385
Consuming fructose-sweetened, not glucose-sweetened, beverages increases visceral adiposity and lipids and decreases insulin sensitivity in overweight/obese humans
Abstract
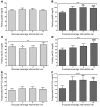
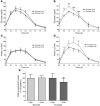
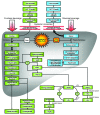
Studies in animals have documented that, compared with glucose, dietary fructose induces dyslipidemia and insulin resistance. To assess the relative effects of these dietary sugars during sustained consumption in humans, overweight and obese subjects consumed glucose- or fructose-sweetened beverages providing 25% of energy requirements for 10 weeks. Although both groups exhibited similar weight gain during the intervention, visceral adipose volume was significantly increased only in subjects consuming fructose. Fasting plasma triglyceride concentrations increased by approximately 10% during 10 weeks of glucose consumption but not after fructose consumption. In contrast, hepatic de novo lipogenesis (DNL) and the 23-hour postprandial triglyceride AUC were increased specifically during fructose consumption. Similarly, markers of altered lipid metabolism and lipoprotein remodeling, including fasting apoB, LDL, small dense LDL, oxidized LDL, and postprandial concentrations of remnant-like particle-triglyceride and -cholesterol significantly increased during fructose but not glucose consumption. In addition, fasting plasma glucose and insulin levels increased and insulin sensitivity decreased in subjects consuming fructose but not in those consuming glucose. These data suggest that dietary fructose specifically increases DNL, promotes dyslipidemia, decreases insulin sensitivity, and increases visceral adiposity in overweight/obese adults.
Figures


Comment in
-
Dietary sugars: a fat difference.J Clin Invest. 2009 May;119(5):1089-92. doi: 10.1172/jci39332. J Clin Invest. 2009. PMID: 19422101 Free PMC article.
Similar articles
-
Dietary sugars: a fat difference.J Clin Invest. 2009 May;119(5):1089-92. doi: 10.1172/jci39332. J Clin Invest. 2009. PMID: 19422101 Free PMC article.
-
Effects of sugar-sweetened beverages on plasma acylation stimulating protein, leptin and adiponectin: relationships with metabolic outcomes.Obesity (Silver Spring). 2013 Dec;21(12):2471-80. doi: 10.1002/oby.20437. Epub 2013 Jun 13. Obesity (Silver Spring). 2013. PMID: 23512943 Free PMC article.
-
Endocrine and metabolic effects of consuming fructose- and glucose-sweetened beverages with meals in obese men and women: influence of insulin resistance on plasma triglyceride responses.J Clin Endocrinol Metab. 2009 May;94(5):1562-9. doi: 10.1210/jc.2008-2192. Epub 2009 Feb 10. J Clin Endocrinol Metab. 2009. PMID: 19208729 Free PMC article. Clinical Trial.
-
Endocrine and metabolic effects of consuming beverages sweetened with fructose, glucose, sucrose, or high-fructose corn syrup.Am J Clin Nutr. 2008 Dec;88(6):1733S-1737S. doi: 10.3945/ajcn.2008.25825D. Am J Clin Nutr. 2008. PMID: 19064538 Free PMC article. Review.
-
Sugar consumption, metabolic disease and obesity: The state of the controversy.Crit Rev Clin Lab Sci. 2016;53(1):52-67. doi: 10.3109/10408363.2015.1084990. Epub 2015 Sep 17. Crit Rev Clin Lab Sci. 2016. PMID: 26376619 Free PMC article. Review.
Cited by
-
Lipoprotein subfractions in metabolic syndrome and obesity: clinical significance and therapeutic approaches.Nutrients. 2013 Mar 18;5(3):928-48. doi: 10.3390/nu5030928. Nutrients. 2013. PMID: 23507795 Free PMC article. Review.
-
Quercetin Preserves β -Cell Mass and Function in Fructose-Induced Hyperinsulinemia through Modulating Pancreatic Akt/FoxO1 Activation.Evid Based Complement Alternat Med. 2013;2013:303902. doi: 10.1155/2013/303902. Epub 2013 Feb 27. Evid Based Complement Alternat Med. 2013. PMID: 23533474 Free PMC article.
-
Does high sugar consumption exacerbate cardiometabolic risk factors and increase the risk of type 2 diabetes and cardiovascular disease?Food Nutr Res. 2012;56. doi: 10.3402/fnr.v56i0.19104. Epub 2012 Jul 30. Food Nutr Res. 2012. PMID: 22855643 Free PMC article.
-
The effects of four hypocaloric diets containing different levels of sucrose or high fructose corn syrup on weight loss and related parameters.Nutr J. 2012 Aug 6;11:55. doi: 10.1186/1475-2891-11-55. Nutr J. 2012. PMID: 22866961 Free PMC article. Clinical Trial.
-
Dual probiotic strains suppress high fructose-induced metabolic syndrome.World J Gastroenterol. 2013 Jan 14;19(2):274-83. doi: 10.3748/wjg.v19.i2.274. World J Gastroenterol. 2013. PMID: 23345951 Free PMC article.
References
-
- Le K.A., Tappy L. Metabolic effects of fructose. Curr. Opin. Clin. Nutr. Metab. Care. 2006;9:469–475. - PubMed
Publication types
MeSH terms
Substances
Grants and funding
LinkOut - more resources
Full Text Sources
Other Literature Sources
Miscellaneous

