Insulin-modulated Akt subcellular localization determines Akt isoform-specific signaling
- PMID: 19372382
- PMCID: PMC2678468
- DOI: 10.1073/pnas.0901933106
Insulin-modulated Akt subcellular localization determines Akt isoform-specific signaling
Abstract
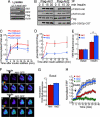
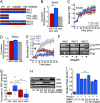
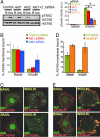
The 3 Akt protein kinase isoforms have critical and distinct functions in the regulation of metabolism, cell growth, and apoptosis, yet the mechanisms by which their signaling specificity is achieved remain largely unclear. Here, we investigated potential mechanisms underlying Akt isoform functional specificity by using Akt2-specific regulation of glucose transport in insulin-stimulated adipocytes as a model system. We found that insulin activates both Akt1 and Akt2 in adipocytes, but differentially regulates the subcellular distribution of these Akt isoforms. The greater accumulation of Akt2 at the plasma membrane (PM) of insulin-stimulated adipocytes correlates with Akt2-specific regulation of the trafficking of the GLUT4 glucose transporter. Consistent with this pattern, Akt constructs that do not accumulate at the PM to the same degree as Akt2 fail to regulate GLUT4 translocation to the PM, whereas enhancement of Akt1 PM association through mutation in Akt1 PH domain is sufficient to overcome Akt-isoform specificity in GLUT4 regulation. Indeed, we found that this distinct insulin-induced PM accumulation of Akt kinases is translated into a differential regulation by the Akt isoforms of AS160, a RabGAP that regulates GLUT4 trafficking. Our data show that Akt2 specifically regulates AS160 phosphorylation and membrane association providing molecular basis for Akt2 specificity in the modulation of GLUT4 trafficking. Together, our findings reveal the stimulus-induced subcellular compartmentalization of Akt kinases as a mechanism contributing to specify Akt isoform functions.
Conflict of interest statement
The authors declare no conflict of interest.
Figures


Similar articles
-
Development of a new model system to dissect isoform specific Akt signalling in adipocytes.Biochem J. 2015 Jun 15;468(3):425-34. doi: 10.1042/BJ20150191. Epub 2015 Apr 9. Biochem J. 2015. PMID: 25856301 Free PMC article.
-
The glucose transporter 4 FQQI motif is necessary for Akt substrate of 160-kilodalton-dependent plasma membrane translocation but not Golgi-localized (gamma)-ear-containing Arf-binding protein-dependent entry into the insulin-responsive storage compartment.Mol Endocrinol. 2007 Dec;21(12):3087-99. doi: 10.1210/me.2006-0476. Epub 2007 Aug 30. Mol Endocrinol. 2007. PMID: 17761952
-
C2 domain-containing phosphoprotein CDP138 regulates GLUT4 insertion into the plasma membrane.Cell Metab. 2011 Sep 7;14(3):378-89. doi: 10.1016/j.cmet.2011.06.015. Cell Metab. 2011. PMID: 21907143 Free PMC article.
-
Role of Akt substrate of 160 kDa in insulin-stimulated and contraction-stimulated glucose transport.Appl Physiol Nutr Metab. 2007 Jun;32(3):557-66. doi: 10.1139/H07-026. Appl Physiol Nutr Metab. 2007. PMID: 17510697 Review.
-
AKT ISOFORMS-AS160-GLUT4: The defining axis of insulin resistance.Rev Endocr Metab Disord. 2021 Dec;22(4):973-986. doi: 10.1007/s11154-021-09652-2. Epub 2021 Apr 30. Rev Endocr Metab Disord. 2021. PMID: 33928491 Review.
Cited by
-
Systematic Analysis Reveals Elongation Factor 2 and α-Enolase as Novel Interaction Partners of AKT2.PLoS One. 2013 Jun 18;8(6):e66045. doi: 10.1371/journal.pone.0066045. Print 2013. PLoS One. 2013. PMID: 23823123 Free PMC article.
-
Impact of GLO1 knock down on GLUT4 trafficking and glucose uptake in L6 myoblasts.PLoS One. 2013 May 23;8(5):e65195. doi: 10.1371/journal.pone.0065195. Print 2013. PLoS One. 2013. PMID: 23717693 Free PMC article.
-
Novel mechanistic link between focal adhesion remodeling and glucose-stimulated insulin secretion.J Biol Chem. 2012 Jan 20;287(4):2423-36. doi: 10.1074/jbc.M111.279885. Epub 2011 Dec 2. J Biol Chem. 2012. PMID: 22139838 Free PMC article.
-
Systematic Interrogation of the Temperature Perturbation in the Insulin Signaling Pathway for Optogenetic Stimulation.Cells. 2022 Oct 5;11(19):3136. doi: 10.3390/cells11193136. Cells. 2022. PMID: 36231098 Free PMC article.
-
Insulin-regulated aminopeptidase is a key regulator of GLUT4 trafficking by controlling the sorting of GLUT4 from endosomes to specialized insulin-regulated vesicles.Mol Biol Cell. 2010 Jun 15;21(12):2034-44. doi: 10.1091/mbc.e10-02-0158. Epub 2010 Apr 21. Mol Biol Cell. 2010. PMID: 20410133 Free PMC article.
References
-
- Woodgett JR. Recent advances in the protein kinase B signaling pathway. Curr Opin CellBiol. 2005;17:150–157. - PubMed
-
- Dummler B, Hemmings BA. Physiological roles of PKB/Akt isoforms in development and disease. Biochem Soc Trans. 2007;35(Pt 2):231–235. - PubMed
-
- Whiteman EL, Cho H, Birnbaum MJ. Role of Akt/protein kinase B in metabolism. Trends Endocrinol Metab. 2002;13:444–451. - PubMed
-
- Cho H, et al. Insulin resistance and a diabetes mellitus-like syndrome in mice lacking the protein kinase Akt2 (PKB beta) Science. 2001;292:1728–1731. - PubMed
Publication types
MeSH terms
Substances
Grants and funding
LinkOut - more resources
Full Text Sources
Medical
Molecular Biology Databases
Miscellaneous

