. 2009 Jul 24;284(30):19843-55.
doi: 10.1074/jbc.M109.003301. Epub 2009 Apr 16.

Absence of nitric-oxide synthase in sequentially purified rat liver mitochondria

Affiliations

Absence of nitric-oxide synthase in sequentially purified rat liver mitochondria

Priya Venkatakrishnan et al. J Biol Chem. .

Abstract

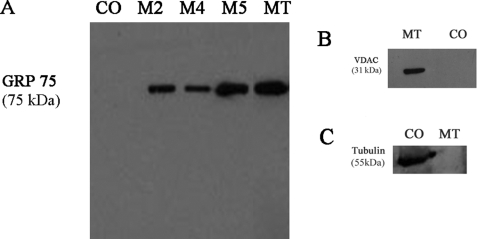
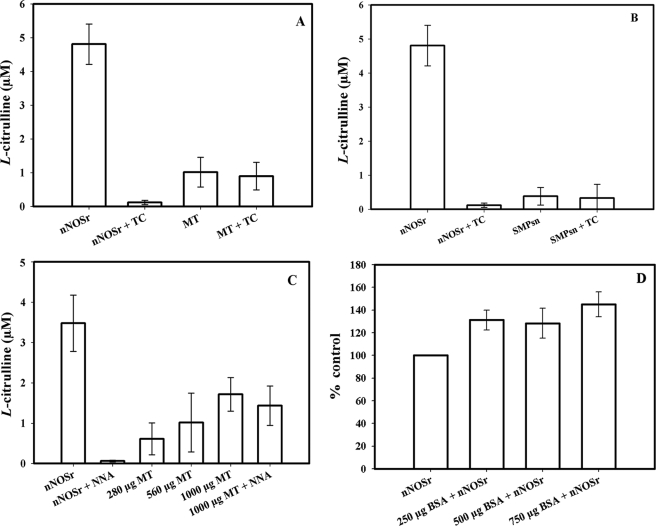
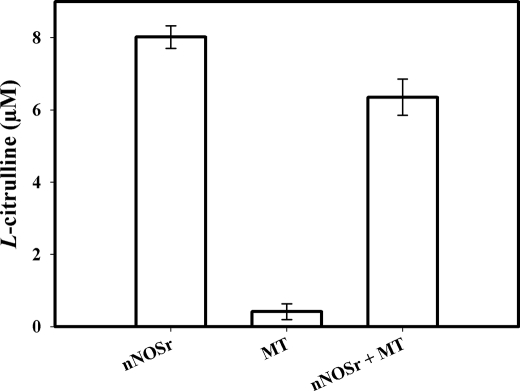
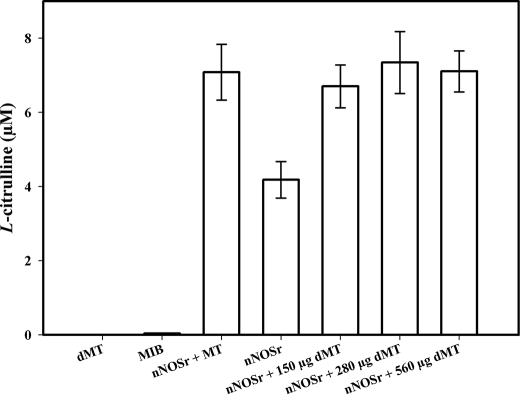
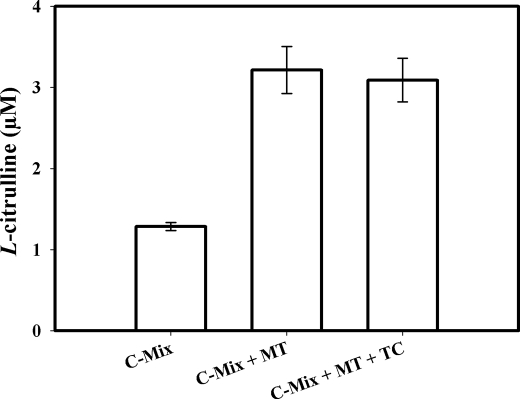
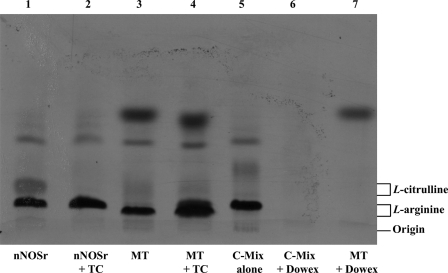
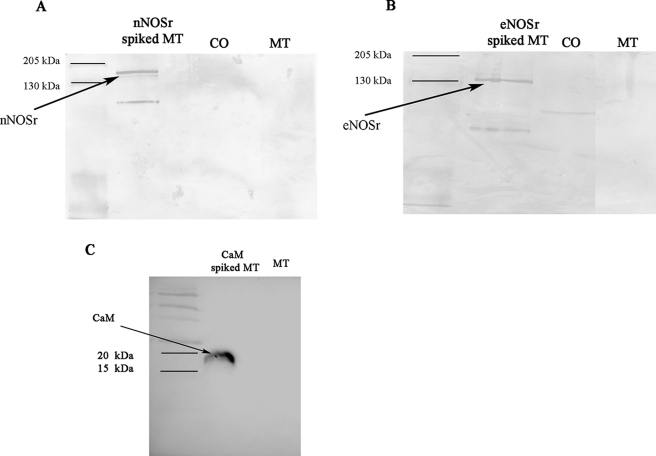
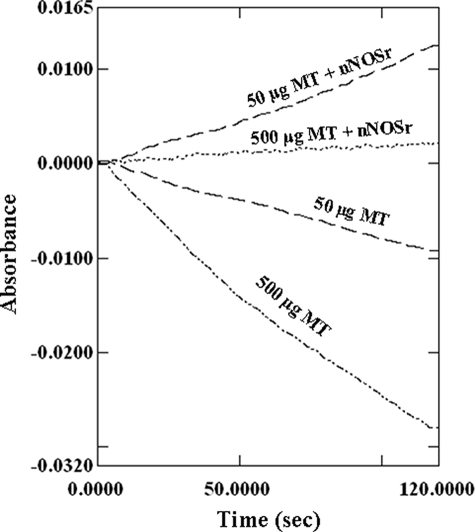
Data, both for and against the presence of a mitochondrial nitric-oxide synthase (NOS) isoform, is in the refereed literature. However, irrefutable evidence has not been forthcoming. In light of this controversy, we designed studies to investigate the existence of the putative mitochondrial NOS. Using repeated differential centrifugation followed by Percoll gradient fractionation, ultrapure, never frozen rat liver mitochondria and submitochondrial particles were obtained. Following trypsin digestion and desalting, the mitochondrial samples were analyzed by nano-HPLC-coupled linear ion trap-mass spectrometry. Linear ion trap-mass spectrometry analyses of rat liver mitochondria as well as submitochondrial particles were negative for any peptide from any NOS isoform. However, recombinant neuronal NOS-derived peptides from spiked mitochondrial samples were easily detected, down to 50 fmol on column. The protein calmodulin (CaM), absolutely required for NOS activity, was absent, whereas peptides from CaM-spiked samples were detected. Also, l-[(14)C]arginine to l-[(14)C]citrulline conversion assays were negative for NOS activity. Finally, Western blot analyses of rat liver mitochondria, using NOS (neuronal or endothelial) and CaM antibodies, were negative for any NOS isoform or CaM. In conclusion, and in light of our present limits of detection, data from carefully conducted, properly controlled experiments for NOS detection, utilizing three independent yet complementary methodologies, independently as well as collectively, refute the claim that a NOS isoform exists within rat liver mitochondria.


Figures

FIGURE 1.
FIGURE 1.
Immunochemical analyses of rat liver mitochondrial fractions with antibodies against mitochondrial and nonmitochondrial markers. Proteins collected during mitochondrial isolation and purification steps (M2, 10,000 × g; M4, 10,000 × g; M5, 9,000 × g; MT, intact MT after repeated differential centrifugation and Percoll gradient purification; and CO, control tissue homogenate) were separated by SDS-PAGE and transferred onto nitrocellulose membranes as described (see under “Experimental Procedures”). Western blotting was performed with antibodies against the following: A, mitochondrial matrix marker, GRP 75; B, mitochondrial outer membrane marker, VDAC; or C, cytosol marker, tubulin. The immunocomplexes were visualized by the HRP-conjugate reaction using a chemiluminescence substrate (Pierce). MT lane, run on the same gel as other fractions, was cropped and pasted alongside other fractions after removing the intervening lanes.
FIGURE 2.
FIGURE 2.
l-[14C]Arginine to l-[14C]citrulline conversion assay using MT, SMP, and a pure protein, BSA. Measurement of the conversion of l-[14C]arginine to l-[14C]citrulline was performed on MT, SMP, as well as on nNOSr plus BSA. Control values from incubation containing all ingredients except enzyme or MT were subtracted from all data points. Data were expressed as the mean ± range of values, of experimental data points from two independent experiments, each run in duplicate. The positive control was nNOSr (30 nm) in all experiments (A–C, 1st bar). l-[14C]Citrulline production by nNOSr was almost completely inhibited by the NOS inhibitors, thiocitrulline (800 μm; denoted as TC; 2nd bar on A and B) and l-NNA (400 μm; C, 2nd bar). l-[14C]Citrulline production was by the following: A, MT (150 μg; 3rd bar) and MT + TC (150 μg; 4th bar). B, SMP from 150 μg of MT (3rd bar) and SMP + TC (4th bar). C, intact MT of various amounts as follows: 280 μg (3rd bar), 560 μg (4th bar), and 1000 μg (5th bar), and 1000 μg of MT + l-NNA (6th bar). D, nNOSr (30 nm) plus BSA of various amounts as follows: 250 (2nd bar), 500 (3rd bar), and 750 μg (4th bar). Here, values are represented as the percentage change in relation to control radioactivity of nNOSr alone (shown as 1st bar).
FIGURE 3.
FIGURE 3.
l-[14C]Citrulline production in the presence of NADPH-regenerating system. Measurement of the conversion of l-[14C]arginine to l-[14C]citrulline was performed using an NADPH-regenerating system containing glucose 6-phosphate (125 mm), NADP (12.5 mm), and 1 unit of glucose-6-phosphate dehydrogenase. 1st bar, positive control, nNOSr (30 nm); 2nd bar, MT (150 μg); 3rd bar, MT (150 μg) + nNOSr (30 nm). Values from control incubations containing all ingredients except enzyme were subtracted from all data points. Data were expressed as the mean ± range of values, of experimental data points from two independent experiments, each run in duplicate.
FIGURE 4.
FIGURE 4.
l-[14C]Citrulline production assays containing nNOSr with dMT. Measurement of the conversion of l-[14C]arginine to l-[14C]citrulline was performed on various amounts of dMT in the presence of nNOSr (30 nm). The incubates are as follows: 1st bar, dMT alone; 2nd bar, MIB alone; 3rd bar, nNOSr + intact 150 μg of MT; 4th bar, nNOSr alone; 5th bar, nNOSr + 150 μg of dMT; 6th bar, nNOSr + 280 μg of dMT; 7th bar, nNOSr + 560 μg of dMT. Values from control incubation containing all ingredients except enzyme were subtracted from all data points. Data were expressed as the mean ± range of values, of experimental data points from two independent experiments, each run in duplicate.
FIGURE 5.
FIGURE 5.
Control experiments using l-[14C]citrulline production assays. Data were expressed as the mean ± range of values, of experimental data points from two independent experiments, each run in duplicate. Measurement of the conversion of l-[14C]arginine to l-[14C]citrulline was performed with all substrates and cofactors (l-arginine, CaCl2, CaM, l-[14C]arginine, HEPES) (C-Mix) in the absence of NADPH and BH4. 1st bar, C-Mix; 2nd bar, C-Mix + 150 μg of MT; 3rd bar, C-Mix + 150 μg of MT + 800 μm l-thiocitrulline (denoted as TC). Incubates were eluted with a Dowex column, and scintillation counting was performed.
FIGURE 6.
FIGURE 6.
HP-TLC of the acetone-precipitated supernatants of l-[14C]arginine to l-[14C]citrulline conversion assay eluates. Acetone-precipitated l-[14C]arginine to l-[14C]citrulline conversion assay eluates (lanes 1–7) and the standards, l-arginine and l-citrulline, were loaded on a plate coated with silica gel, and HP-TLC was performed and developed as described (see “Experimental Procedures”). The lane pattern in HP-TLC was as follows: nNOSr, positive control detecting l-[14C]arginine (substrate) and l-[14C]citrulline (product) (lane 1); nNOSr + l-thiocitrulline (denoted as TC), negative control for NOS reaction showing no conversion of l-[14C]arginine to l-[14C]citrulline (lane 2); MT included in the assay, no conversion of l-[14C]arginine to l-[14C]citrulline (lane 3); MT + TC included in the assay, no conversion of l-[14C]arginine to l-[14C]citrulline (lane 4); C-Mix standard without MT or nNOSr, negative control for l-[14C]citrulline (lane 5); C-Mix followed by Dowex chromatography, no l-[14C]arginine, no l-[14C]citrulline, and no unidentified bands (lane 6); MT included in the assay followed by Dowex chromatography, no conversion of l-[14C]arginine to l-[14C]citrulline. The migration of authentic standards of l-arginine and l-citrulline, as detected by ninhydrin staining, is indicated on the right.
FIGURE 7.
FIGURE 7.
Immunochemical analyses of MT using NOS and CaM antibodies. Proteins were separated with SDS-polyacrylamide gel under the conditions described under “Experimental Procedures.” 8 μl of protein prestained standard (Bio-Rad) was loaded (1st lane). Western blots were performed with the following. A, rabbit nNOS antibody. The positive control was 30 ng of NOSr spiked in 150 μg of MT (lane 2). B, rabbit monoclonal eNOS antibody. The positive control was 30 ng of eNOSr spiked in 150 μg of MT (2nd lane). The immunocomplexes of A and B were developed by alkaline phosphatase reaction using 5-bromo-4-chloro-3-indolyl phosphate/nitro blue tetrazolium substrate. MT lane, run on the same gel as other fractions, was cropped and pasted along with other fractions after removing intervening lanes. C, rabbit CaM antibody. The positive control was 30 ng of CaM spiked in 150 μg of MT (2nd lane). The immunocomplexes were developed by HRP conjugate using a chemiluminescence substrate (Pierce), and MT denotes 150 μg of purified mitochondria (3rd lane).
FIGURE 8.
FIGURE 8.
Oxyhemoglobin capture assay with mildly sonicated MT. Mildly sonicated MT (50 and 500 μg) along with SOD and CAT (50 units each) were incubated, and the assays were performed as mentioned (57). The rate of absorbance of mildly sonicated MT (50 and 500 μg) was negative in slope. When nNOSr (5 pmol) were spiked, the curves shifted positive.

Similar articles

Cited by

References

    1. Ignarro L. J. (1989) FASEB J. 3, 31–36 - PubMed
    1. Shin W. S., Sasaki T., Kato M., Hara K., Seko A., Yang W. D., Shimamoto N., Sugimoto T., Toyo-oka T. (1992) J. Biol. Chem. 267, 20377–20382 - PubMed
    1. Malinski T., Taha Z., Grunfeld S., Patton S., Kapturczak M., Tomboulian P. (1993) Biochem. Biophys. Res. Commun. 193, 1076–1082 - PubMed
    1. Ignarro L. J., Buga G. M., Byrns R. E., Wood K. S., Chaudhuri G. (1988) J. Pharmacol. Exp. Ther. 246, 218–226 - PubMed
    1. Thomas D. D., Liu X., Kantrow S. P., Lancaster J. R., Jr. (2001) Proc. Natl. Acad. Sci. U. S. A. 98, 355–360 - PMC - PubMed

Publication types

MeSH terms

LinkOut - more resources