

An ENU-induced mutation of miR-96 associated with progressive hearing loss in mice
- PMID: 19363478
- PMCID: PMC2705913
- DOI: 10.1038/ng.369
An ENU-induced mutation of miR-96 associated with progressive hearing loss in mice
Abstract
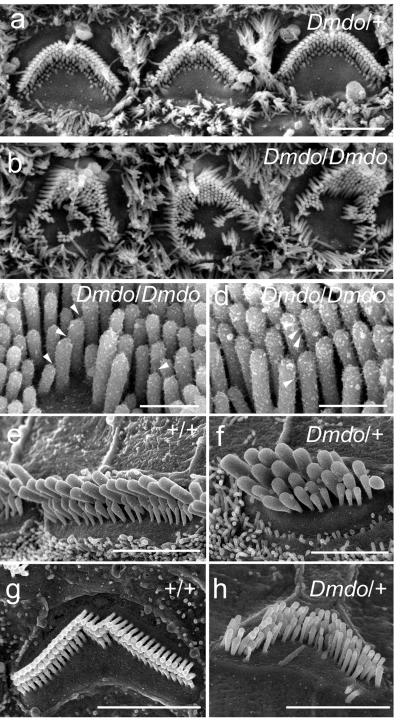
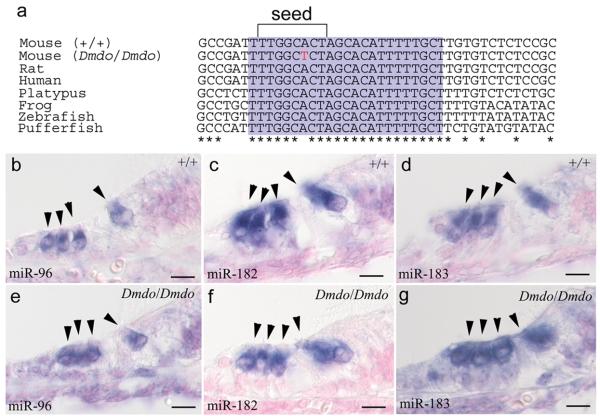
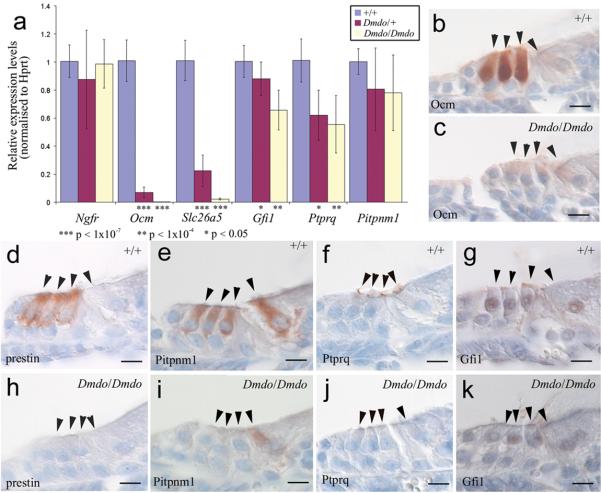
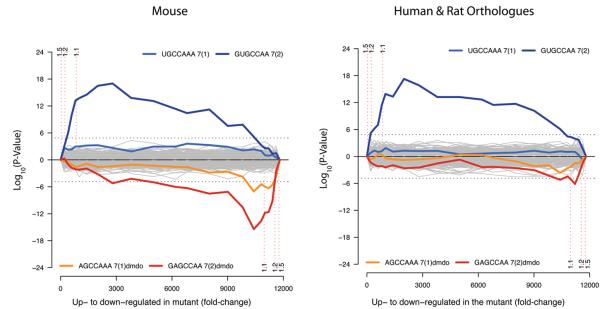
Progressive hearing loss is common in the human population, but little is known about the molecular basis. We report a new N-ethyl-N-nitrosurea (ENU)-induced mouse mutant, diminuendo, with a single base change in the seed region of Mirn96. Heterozygotes show progressive loss of hearing and hair cell anomalies, whereas homozygotes have no cochlear responses. Most microRNAs are believed to downregulate target genes by binding to specific sites on their mRNAs, so mutation of the seed should lead to target gene upregulation. Microarray analysis revealed 96 transcripts with significantly altered expression in homozygotes; notably, Slc26a5, Ocm, Gfi1, Ptprq and Pitpnm1 were downregulated. Hypergeometric P-value analysis showed that hundreds of genes were upregulated in mutants. Different genes, with target sites complementary to the mutant seed, were downregulated. This is the first microRNA found associated with deafness, and diminuendo represents a model for understanding and potentially moderating progressive hair cell degeneration in hearing loss more generally.
Figures
Comment in
-
MicroRNAs become large in hearing loss.Clin Genet. 2009 Oct;76(4):343-5. doi: 10.1111/j.1399-0004.2009.01260_2.x. Clin Genet. 2009. PMID: 19793308 No abstract available.
Similar articles
-
A reduction in Ptprq associated with specific features of the deafness phenotype of the miR-96 mutant mouse diminuendo.Eur J Neurosci. 2014 Mar;39(5):744-56. doi: 10.1111/ejn.12484. Epub 2014 Jan 22. Eur J Neurosci. 2014. PMID: 24446963 Free PMC article.
-
Mutations in the seed region of human miR-96 are responsible for nonsyndromic progressive hearing loss.Nat Genet. 2009 May;41(5):609-13. doi: 10.1038/ng.355. Epub 2009 Apr 12. Nat Genet. 2009. PMID: 19363479
-
Mutations in LOXHD1, an evolutionarily conserved stereociliary protein, disrupt hair cell function in mice and cause progressive hearing loss in humans.Am J Hum Genet. 2009 Sep;85(3):328-37. doi: 10.1016/j.ajhg.2009.07.017. Am J Hum Genet. 2009. PMID: 19732867 Free PMC article.
-
MicroRNAs and epigenetic regulation in the mammalian inner ear: implications for deafness.Mamm Genome. 2009 Sep-Oct;20(9-10):581-603. doi: 10.1007/s00335-009-9230-5. Epub 2009 Oct 30. Mamm Genome. 2009. PMID: 19876605 Review.
-
Hereditary hearing loss: from human mutation to mechanism.Hear Res. 2011 Nov;281(1-2):3-10. doi: 10.1016/j.heares.2011.05.021. Epub 2011 Jun 6. Hear Res. 2011. PMID: 21664957 Review.
Cited by
-
Aqp5 is a new transcriptional target of Dot1a and a regulator of Aqp2.PLoS One. 2013;8(1):e53342. doi: 10.1371/journal.pone.0053342. Epub 2013 Jan 10. PLoS One. 2013. PMID: 23326416 Free PMC article.
-
The miR-183/Taok1 target pair is implicated in cochlear responses to acoustic trauma.PLoS One. 2013;8(3):e58471. doi: 10.1371/journal.pone.0058471. Epub 2013 Mar 5. PLoS One. 2013. PMID: 23472202 Free PMC article.
-
Pigmy MicroRNA: surveillance cops in Therapies kingdom.Mol Med. 2016 Dec;22:759-775. doi: 10.2119/molmed.2016.00136. Epub 2016 Sep 28. Mol Med. 2016. PMID: 27704139 Free PMC article.
-
Discovery of candidate disease genes in ENU-induced mouse mutants by large-scale sequencing, including a splice-site mutation in nucleoredoxin.PLoS Genet. 2009 Dec;5(12):e1000759. doi: 10.1371/journal.pgen.1000759. Epub 2009 Dec 11. PLoS Genet. 2009. PMID: 20011118 Free PMC article.
-
MicroRNAs in hair cell development and deafness.Curr Opin Otolaryngol Head Neck Surg. 2010 Oct;18(5):459-65. doi: 10.1097/MOO.0b013e32833e0601. Curr Opin Otolaryngol Head Neck Surg. 2010. PMID: 20717030 Free PMC article.
References
-
- Gates GA, Couropmitree NN, Myers RH. Genetic associations in age-related hearing thresholds. Arch Otolaryngol Head Neck Surg. 1999;125:654–9. - PubMed
-
- Hrabe de Angelis M, et al. Genome-wide, large-scale production of mutant mice by ENU mutagenesis. Nature Genetics. 2000;25:444–447. - PubMed
-
- Lewis BP, Burge CB, Bartel DP. Conserved seed pairing, often flanked by adenosines, indicates that thousands of human genes are microRNA targets. Cell. 2005;120:15–20. - PubMed
-
- Weston MD, Pierce ML, Rocha-Sanchez S, Beisel KW, Soukup GA. MicroRNA gene expression in the mouse inner ear. Brain Research. 2006;1111:95–104. - PubMed
Publication types
MeSH terms
Substances
Grants and funding
LinkOut - more resources
Full Text Sources
Other Literature Sources
Molecular Biology Databases
