. 2009;4(4):e5153.
doi: 10.1371/journal.pone.0005153. Epub 2009 Apr 10.

Estradiol activates beta-catenin dependent transcription in neurons

Affiliations

Estradiol activates beta-catenin dependent transcription in neurons

Olga Varea et al. PLoS One. 2009.

Abstract

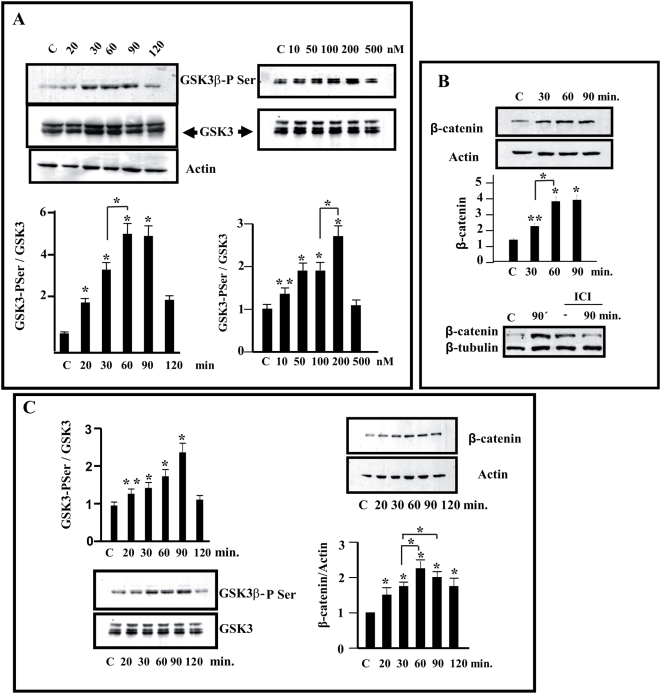
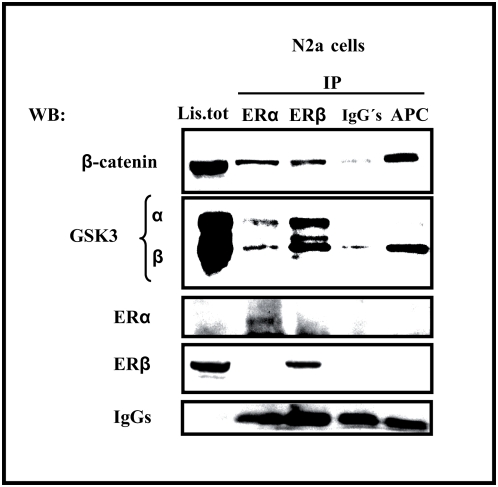
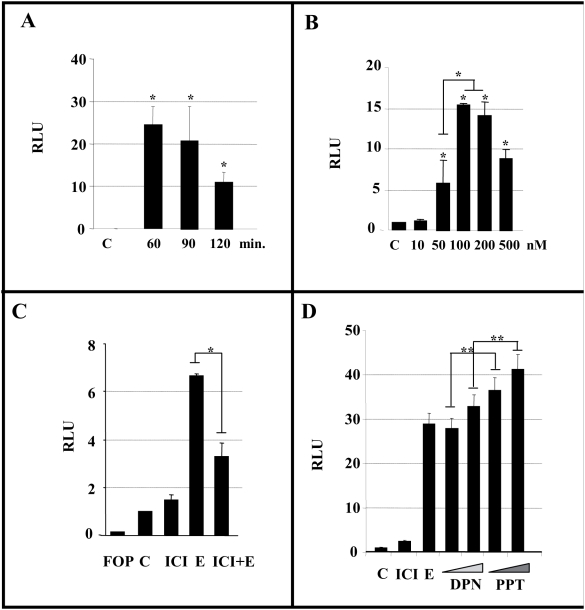
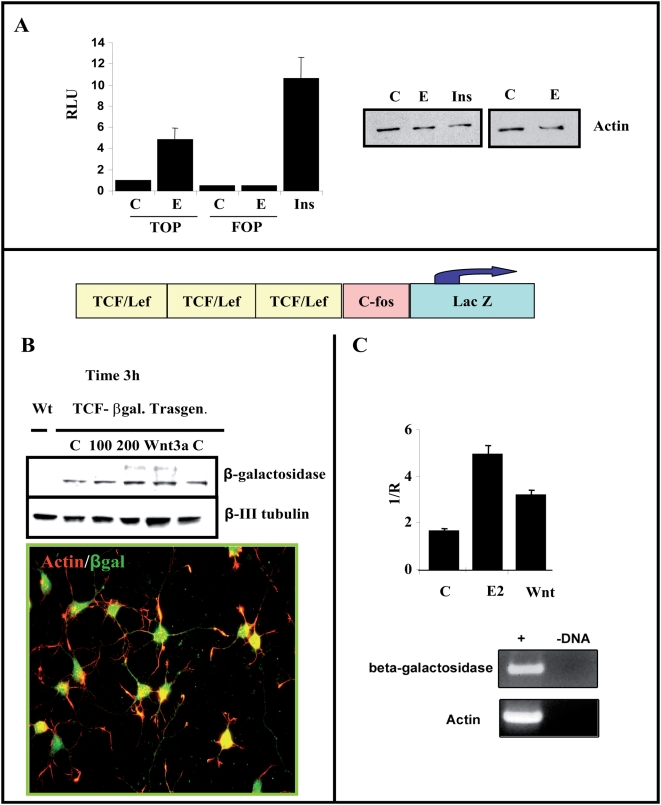
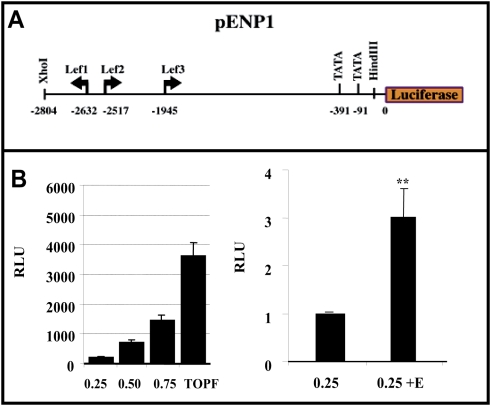
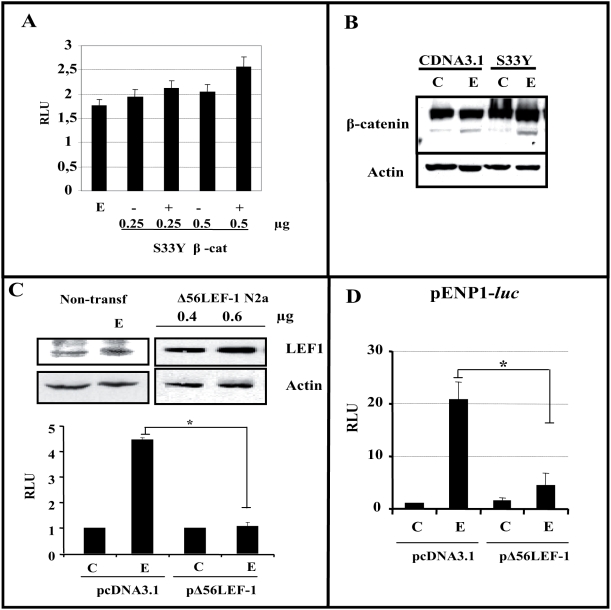
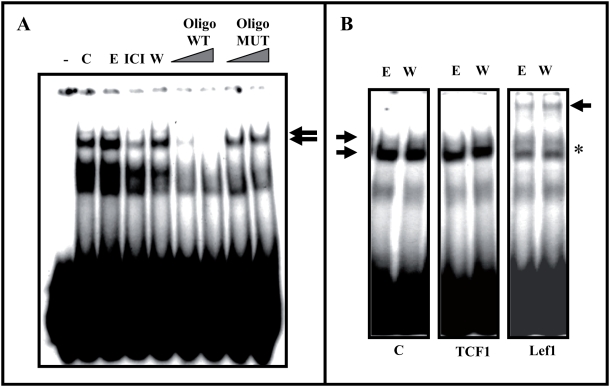
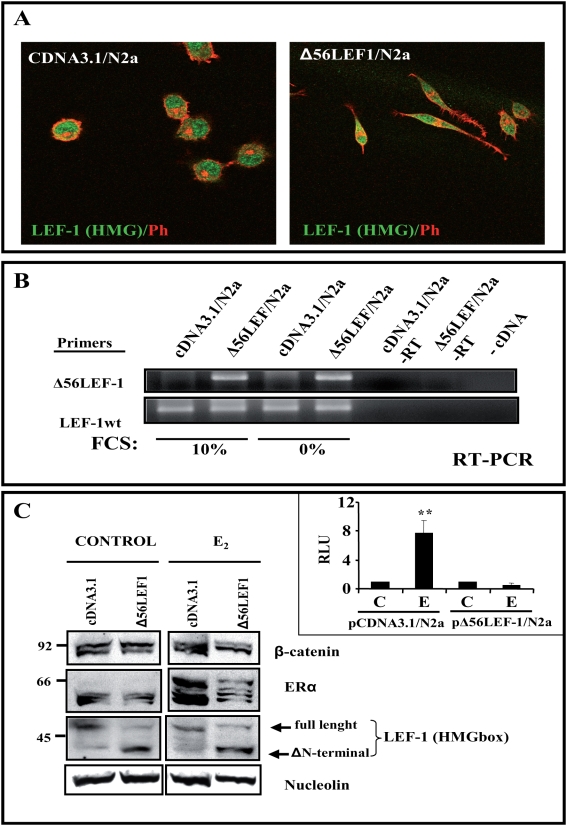
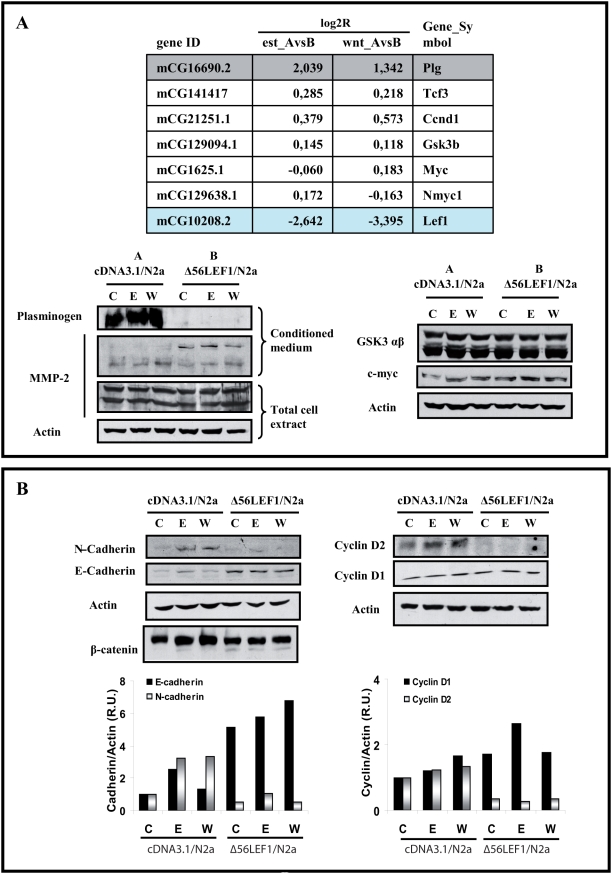
Estradiol may fulfill a plethora of functions in neurons, in which much of its activity is associated with its capacity to directly bind and dimerize estrogen receptors. This hormone-protein complex can either bind directly to estrogen response elements (ERE's) in gene promoters, or it may act as a cofactor at non-ERE sites interacting with other DNA-binding elements such as AP-1 or c-Jun. Many of the neuroprotective effects described for estrogen have been associated with this mode of action. However, recent evidence suggests that in addition to these "genomic effects", estrogen may also act as a more general "trophic factor" triggering cytoplasmic signals and extending the potential activity of this hormone. We demonstrated that estrogen receptor alpha associates with beta-catenin and glycogen synthase kinase 3 in the brain and in neurons, which has since been confirmed by others. Here, we show that the action of estradiol activates beta-catenin transcription in neuroblastoma cells and in primary cortical neurons. This activation is time and concentration-dependent, and it may be abolished by the estrogen receptor antagonist ICI 182780. The transcriptional activation of beta-catenin is dependent on lymphoid enhancer binding factor-1 (LEF-1) and a truncated-mutant of LEF-1 almost completely blocks estradiol TCF-mediated transcription. Transcription of a TCF-reporter in a transgenic mouse model is enhanced by estradiol in a similar fashion to that produced by Wnt3a. In addition, activation of a luciferase reporter driven by the engrailed promoter with three LEF-1 repeats was mediated by estradiol. We established a cell line that constitutively expresses a dominant-negative LEF-1 and it was used in a gene expression microarray analysis. In this way, genes that respond to estradiol or Wnt3a, sensitive to LEF-1, could be identified and validated. Together, these data demonstrate the existence of a new signaling pathway controlled by estradiol in neurons. This pathway shares some elements of the insulin-like growth factor-1/Insulin and Wnt signaling pathways, however, our data strongly suggest that it is different from that of both these ligands. These findings may reveal a set of new physiological roles for estrogens, at least in the Central Nervous System (CNS).


Conflict of interest statement

Competing Interests: The authors have declared that no competing interests exist.

Figures

Figure 1
Figure 1. Treatment of estradiol increases Ser9,21-GSK3 phosphorylation and β-catenin accumulation in neuronal cells.
(A)-Neuroblastoma N2a-m were treated with different doses of estradiol and for different times (20–120 min with 10–500 nM) and the maximum increase in GSK3β-PSer9 was observed when they were treated for 60 min with 100–200 nM estradiol. (B)- Stabilization of β-catenin. N2a-m cells treated with estradiol showed a clear increase in β-catenin that could be prevented by prior exposure to ICI 182780 (used 100× concentrated in comparison to estradiol), 60 minutes before estradiol treatment (lower panel). (C)-Cortical Primary Neurons (2DIV) were treated with estradiol (100 nM) and the maximum increase in GSK3β-PSer9 and the subsequent stabilization of β-catenin was clearly detected 60–90 min after the onset of exposure. In all cases diagram shows the mean normalized densitometry values and the corresponding standard deviations from at least three independent experiments. Asterisks indicate statistical significance (Student's t-test) ** (P≤0.05), * (P≤0.01). The single * or ** compares data to control whereas the bar between different points shows statistical differences between experimental values.
Figure 2
Figure 2. Estrogen receptors form a complex with β-catenin and GSK3 in N2a-m cells.
ERα and ERβ were immunoprecipitated from N2a-m cells, and similar endogenous protein complexes were observed with both antibodies. Immunoprecipitation with an anti-APC antibody is shown as an internal control of a β-catenin interacting protein. Both GSK3 isoforms were detected in the immunocomplex recovered with ERα or ERβ antibodies, whereas GSK3β is the major isoform recovered with APC antibodies, used as a positive control. The immunoprecipitation also shows a fraction of β-catenin associated with both ER isoforms. IgG's represent the IP using irrelevant IgGs as a negative control.
Figure 3
Figure 3. Estradiol augments TCF/LEF-dependent transcription in N2a-m cells.
N2a-m cells were transfected with the TOPFlash or FOPFlash reporter plasmid with EGFP-pCDNA3, and the cells were then treated with estradiol and other test compounds for the different times and at the different concentrations indicated. (A–B), Soluble extracts from estradiol treated cells were obtained and luciferase activity was measure as indicated in the Methods. The normalized data were expressed in relative light units (RLU) compared to the control solvent, and the response was maximal at 60 min using 100 nM. (C).The effect of estradiol can be prevented by prior exposure to the ER antagonist ICI 182780 10 µM for 2 hr. (D), Specific agonists of each estrogen receptor (PPT: ERα agonist, and DPN: ERβ agonist, at two concentrations, 5 and 10 nM) also induced TCF/LEF-mediated transcription although PPT was more efficient than DPN. The graphs show the normalized luciferase activity from at least three independent experiments. The P value from the Student's t-test was * (P≤0.05), ** (P≤0.01). The single * or ** compares data to control whereas the bar between different points shows statistical differences between them.
Figure 4
Figure 4. Estradiol increase TCF/LEF-dependent transcription in cortical neurons.
(A)-Cortical neurons from E18 embryos were nucleofected with TOPFlash or FOPFlash reporter plasmids and luciferase activity was analyzed after 2DIV. Estradiol treatment (60 min, 100 nM) selectively increased transcription from the TOPFlash reporter plasmid compared to FOPFlash, which shows no activity. Insulin treatment (5 µg/ml) was used as a control of induction. (B–C)- Expression of the LacZ gene in response to estradiol in transgenic mice. The scheme represents the lacZ transgene under the control of three consensus TCF/LEF-binding motifs upstream of the c-fos promoter, as described in Materials and Methods . (B)-Upper panel. Total extracts of cortical neurons (2DIV) were obtained from a TCF/LEF-lacZ transgenic mouse (see Materials and Methods) and the β-galactosidase (β-gal) expression was assessed in western blots after estradiol treatment (100–200 nM) for 3 h. Wnt3a (20 ng/ml) was used as a control of TCF-mediated induction. A slight increase in β-gal protein was observed after exposure to estradiol, as with recombinant Wnt3a protein. (B), Lower panel. Basal expression of β-galactosidase in neurons from transgenic mice was assessed by immunocytochemistry using specific antibodies against β galactosidase (green) and Phalloidin-labelled with Alexas 549. (C), Alternatively, after treatment with estradiol or Wnt3a, total Lac Z expression was quantified by RT-PCR using specific β-gal oligonucleotides and using actin (a housekeeping gene) as an internal standard (see Methods ). The amplification of both genes was analyzed on agarose gels and the graph represents the normalized data obtained from the Lightcycler analysis. Both treatments clearly increase transcriptional activity when compared to controls.
Figure 5
Figure 5. The engrailed 1-luciferase construct responds to estradiol.
The scheme represents the structure of the 2.8 kB of construct containing the proximal region of endogenous engrailed 1 promoter bind to luciferase reporter. N2a-m cells were transfected with the pENP1-luciferase reporter plasmid (250, 200 and 750 ng) (represented as 0.25, 0.5, 0.75), which contains three LEF-1 sites (see upper panel). The Lower panel shows a comparison of the induction of TOPFlash (750 ng) and pENP-luc in this cell line. Although basal levels of luciferase activity are lower in the pENP1-luc reporter plasmid, estradiol induces this activity to 3-fold that of the control levels, as shown in the right panel. The graph in B shows the normalized luciferase activity from at least three independent experiments. The P value from the Student's t-test was ** (P≤0.01) when compared with control data.
Figure 6
Figure 6. Interaction of β-catenin/LEF-1 mediates the transcriptional capacity of estradiol.
(A)-β-catenin/TCF estradiol-mediated transcription depends on the phosphorylation of β-catenin. N2a-m cells were transfected with different amounts of the S33Y-βcatenin (S33Y-βcat) expression plasmid as indicated (250 or 500 ng). (B)-β-catenin levels in total extracts from cells transfected with S33Y-βcat or the empty cDNA3.1 plasmid, representative of the analysis of lanes (0.5+); and (0.5−) in A. Under the high levels of S33Y-βcat expression estradiol was virtually unable to further induce reporter expression. No statistical differences are founded between the bars data from different experiments. (C)-Interaction of β-catenin with TCFs is essential for estradiol to induce gene transcription through TCF sites. Endogenous LEF-1 protein levels remain unchanged after estradiol treatment for 60–90 min, as seen with the anti-N terminal LEF-1 antibody. Expression of the Δ56LEF-1 protein was detected in western blots after transfection of increasing amounts of plasmid (400 or 600 ng) using an antibody against the HMG box region of LEF-1. The overexpression of a LEF-1 mutant construct (Δ56LEF-1) prevents estradiol from inducing expression from the TOPFlash reporter plasmid when compared with mock-transfected cells. (D)-Δ56LEF-1 reduces estradiol induced luciferase expression from pENP1-luc. The overexpression of Δ56LEF-1 construct reduced the luciferase activity induced by estradiol from the pENP1-Luc plasmid, when compared with mock-transfected cells (empty-pcDNA3). Estradiol (E) induced luciferase activity to 8–15 fold that of the control levels (C and E), in the pENP1-luc reporter. However, the expression of Δ56LEF-1 diminished this induction (compare pCDNA3+E versus Δ56+E). In both cases (C–D), the graphs show the normalized luciferase activity (RLU) from at least three independent experiments. The P value from the Student's t-test was * (P≤0.05).
Figure 7
Figure 7. The LEF-1-DNA complex is detected in nuclear protein extracts and it is modulated by estradiol.
(A)-Identification of the specific band by competition with non-labeled wt oligonucleotides. Nuclear proteins were obtained from N2a-m cells treated for 30 minutes with estradiol, ICI or Wnt3a, enabling specific TCF-DNA complexes to be detected. In control nuclear extracts the presence of a pre-established TCF-DNA complex was detected, which augmented slightly in the presence of estradiol and that decreased upon ICI treatment. The arrow indicates the complex. (B)-Analysis of the identity of the TCF-DNA complex. Antibodies against TCF1, LEF-1, or irrelevant IgGs (C) were added to the nuclear protein extracts and modification of the DNA/protein complex was evaluated. In addition, antibodies against TCF3 or ERα were used in parallel experiments, without producing any modification of this pattern (Supplementary Figure S4). Only in the case of the anti-LEF-1 antibody was a more slowly migrating band observed. The arrow with an asterisk indicates the appearance of a higher molecular weight complex.
Figure 8
Figure 8. Generation of a stable N2a-m cell line expressing the Δ56LEF-1 protein.
N2a-m cells were co-transfected with Δ56LEF-1 or the empty pCDNA3 vector containing the Puromycin resistance gene (for details see Methods ). (A)- N2a-m-Δ56LEF-1 expression was observed by dual immunocytochemistry using an LEF-HMGbox antibody (green) and Phalloidin (red). Note the morphological changes associated with the expression of LEF-1 mutant. (B)- RNA from the different stable N2a-m cell lines was obtained and the RT-PCR products were analyzed in agarose gels. Expression of the Δ56LEF-1 plasmid was tested using oligos specific to the Δ56LEF-1 plasmid, in parallel with specific oligos recognizing endogenous LEF-1 protein (LEF-1-wt) as controls. Note that no significant differences in plasmid expression were observed between cells growing in 10% FCS compared to those grown in the absence of FCS. (C)-Protein expression was determined to test for the presence of the mutant LEF-1 protein in N2a-m cells. Nuclear extracts were prepared from control and estradiol treated cells, and little accumulation of β-catenin was detected after exposure to estradiol although the estrogen receptor does enter the nucleus. The LEF-HMG box antibody allows us to differentiate full-length LEF-1 from Δ56 LEF-1 in western blots. Nucleolin levels were used as an internal control. The right insert represents the luciferase activity (RLU) of both stable cell lines. A functional analysis was performed to check the loss of estradiol induction over TOPFlash in these cells, as previously reported for the transient transfection (Figure 6C). The graph shows the normalized luciferase activity from at least three independent experiments. The P value from the Student's t-test was ** (P≤0.01) when compared with control data.
Figure 9
Figure 9. Gene expression of cDNA/N2a-m and Δ56LEF-1/N2a-m cells after exposure to estradiol.
(A)- Gene expression profile in cDNA/N2a-m and Δ56LEF-1/N2a-m stables cell lines. The upper panel reflects the gene induction of some selected genes, in microarray analysis of RNA collected after a 45 min exposure to estradiol or Wnt3a to detect the early response. Data is expressed as log2R from cDNA/N2a-m cells, that we denoted as group A, and Δ56LEF-1/N2a-m cells, that we denoted as group B. The effect of the treatment was compared between the two stable cell lines (A vs B) (see “Table 1” for a more complete list of the annotated genes). As seen, in the panel we selected some “putative Wnt-regulated genes”, such as Tcf3, Ccnd1 (cyclin D1), GSK3b, Myc and LEF-1, to give some examples of the results in our arrays. We detected changes at the protein level only in Plg, although there were several genes whose expression varied. For example, the levels of plasminogen RNA were much higher in group B than group A (ratio AvsB≥1), and the expression of LEF-1 was higher in Δ56LEF-1 due to the mutant expression (ratio AvsB≤−1). The western blots below are verifications of these differences at the protein level. Among other proteins that did not change between the groups of cells were GSK3 β or myc (see western blots on the right). MMP-2 was tested although it did not display a change in its RNA levels and there was no difference in the total cell extracts. Interestingly, when conditioned medium was prepared, more pro-active MMP-2 (and less active protein) was seen in Δ56LEF-1 cells. [Gene_Symbol: Plg (plasminogen), Tcf3, Ccnd1 (cyclin D1), GSK3b, Myc and LEF1]. (B)- Estradiol induction of N-cadherin and cyclin D2 may be affected by expression of the Δ56LEF-1 protein. Total cell extracts from cDNA/N2a-m cells (group A) and Δ56LEF-1/N2a-m cells (group B) were collected 24 h after estradiol or Wnt3a treatment to analyze several known Wnt or estrogen target genes. As seen in western blots, estradiol upregulated E-cadherin, N-cadherin and cyclin D2 expression in group A cells. N-cadherin and cyclin D2 were also upregulated by Wnt in group A cells. In contrast, E-cadherin expression was not Wnt responsive. The regulatory effects of estradiol on E-cadherin, N-cadherin and cyclin D2 expression were lost when Δ56LEF-1 is expressed, as seen in group B cells. In the case of E-cadherin, the loss of functional LEF-1, which acts as a known gene repressor, implies higher protein levels even without stimulation. In contrast, levels of actin or cyclin D1 remained unchanged.

Similar articles

Cited by

References

    1. Wang CN, Chi CW, Lin YL, Chen CF, Shiao YJ. The neuroprotective effects of phytoestrogens on amyloid beta protein- induced toxicity are mediated by abrogating the activation of caspase cascade in rat cortical neurons. J Biol Chem. 2001;(7):5287–5295. - PubMed
    1. Garcia-Segura LM, Azcoitia I, DonCarlos LL. Neuroprotection by estradiol. Prog Neurobiol. 2001;63(1):29–60. - PubMed
    1. Wise P. Estradiol exerts neuroprotective actions against ischemic brain injury: insights derived from animal models. Endocrine. 2003;21(1):11–15. - PubMed
    1. McKenna NJ, O'Malley BW. Nuclear receptors, coregulators, ligands, and selective receptor modulators: making sense of the patchwork quilt. Ann N Y Acad Sci. 2001;949:3–5. - PubMed
    1. Beato M, Herrlich P, Schutz G. Steroid hormone receptors: many actors in search of a plot. Cell. 1995;83(6):851–857. - PubMed

Publication types