

Image-driven population analysis through mixture modeling
- PMID: 19336293
- PMCID: PMC2832589
- DOI: 10.1109/TMI.2009.2017942
Image-driven population analysis through mixture modeling
Abstract
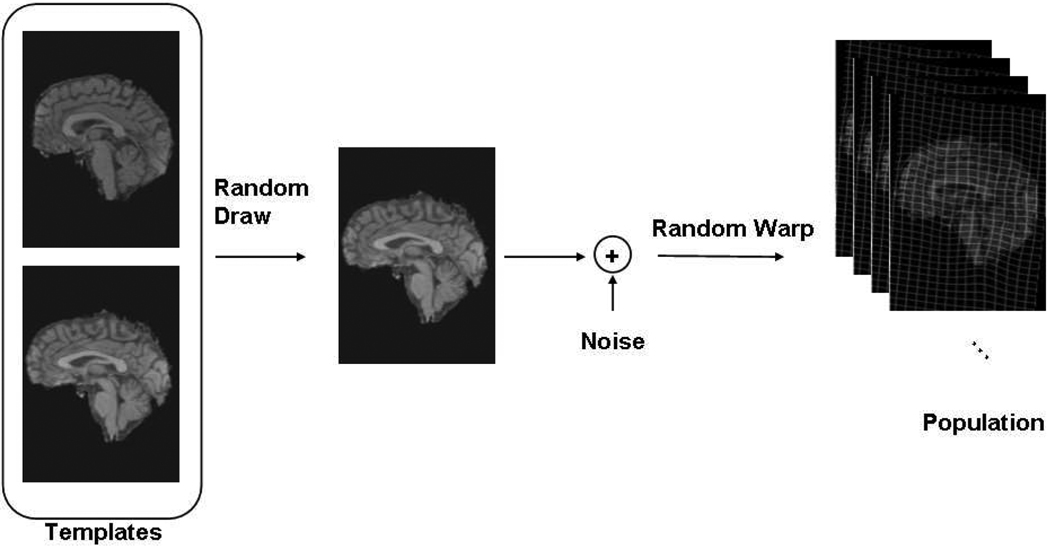
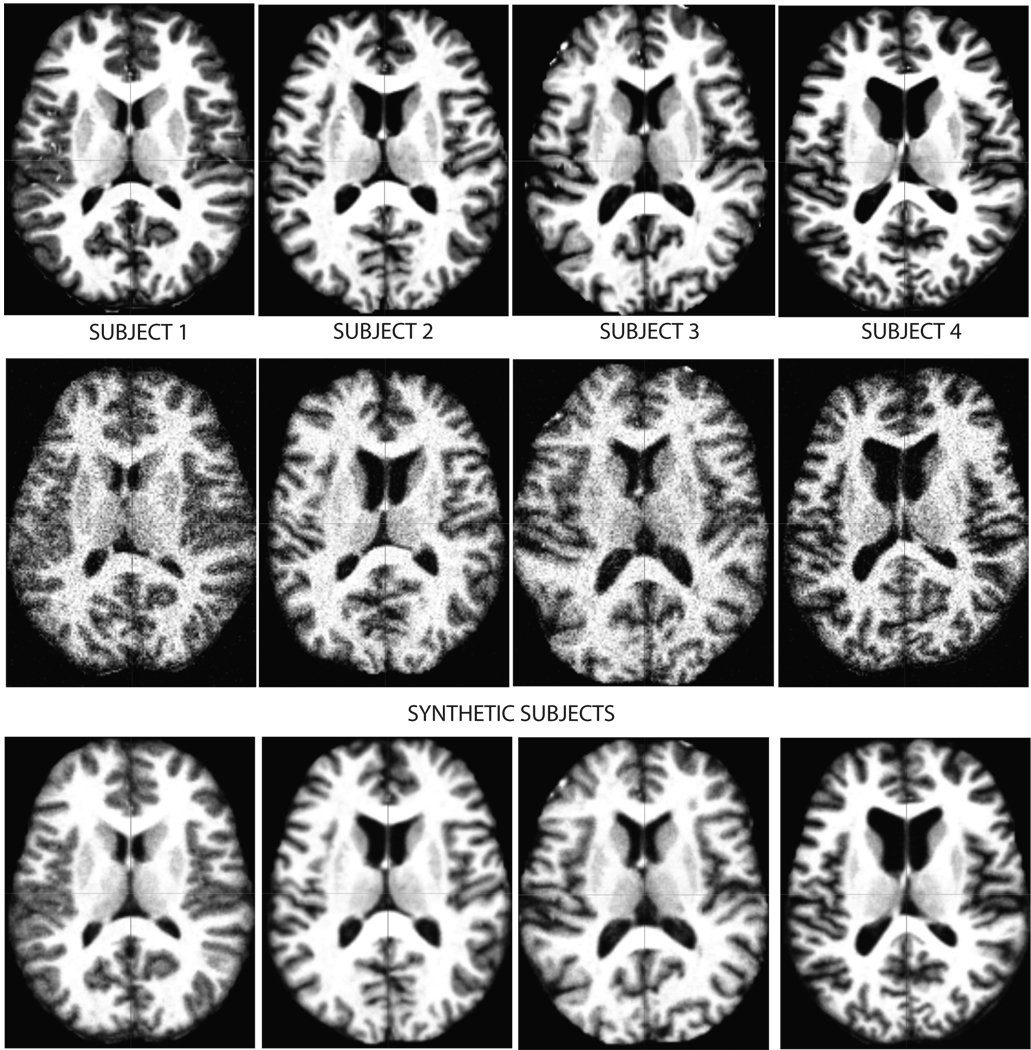
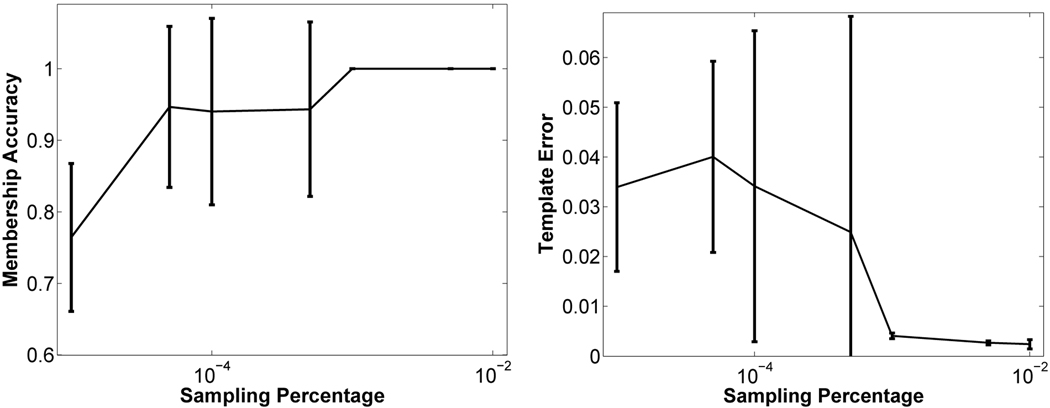
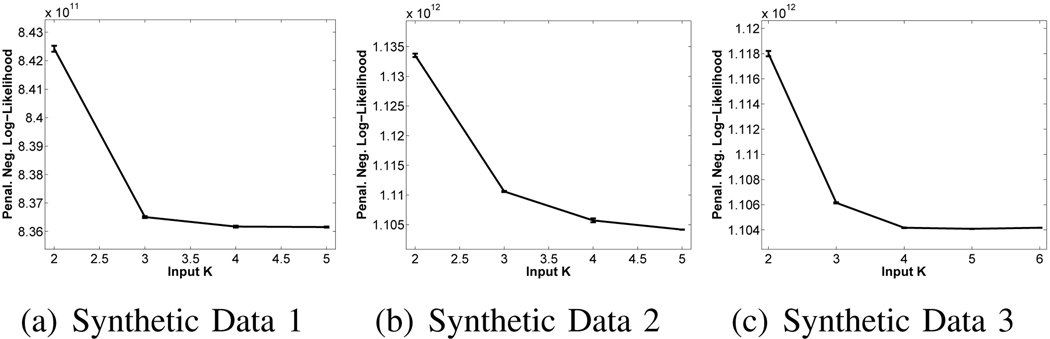
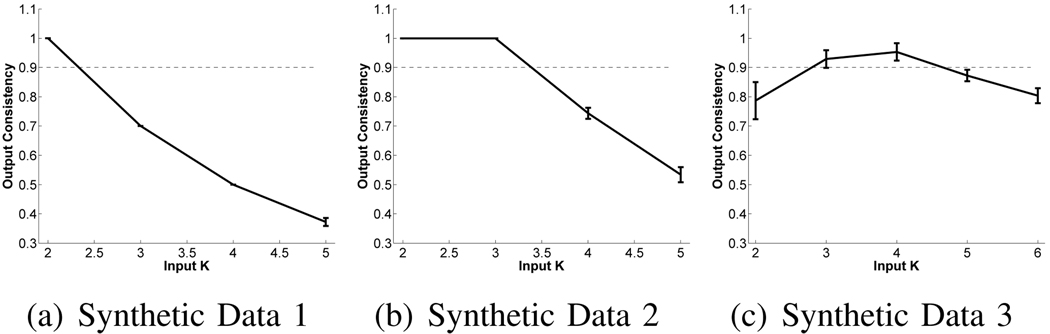
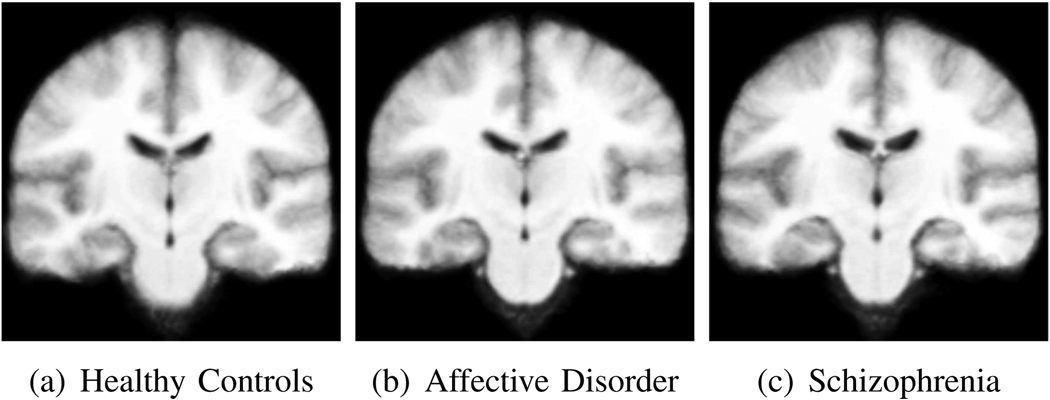
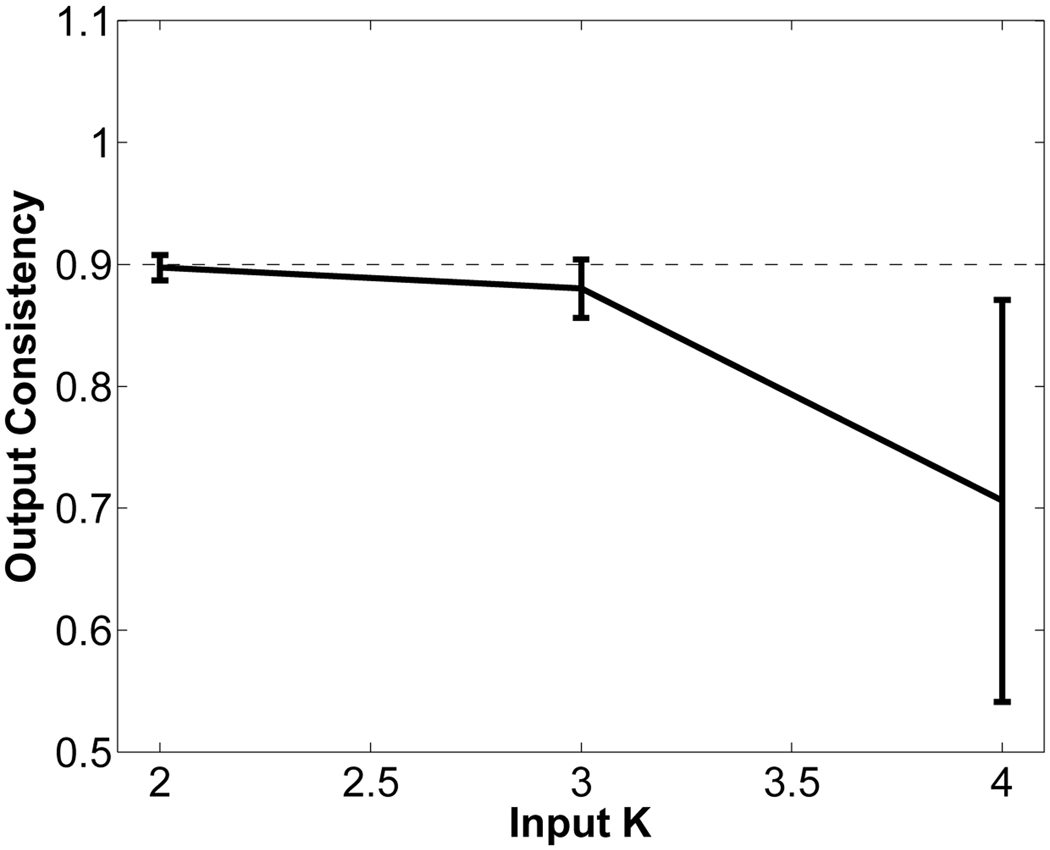
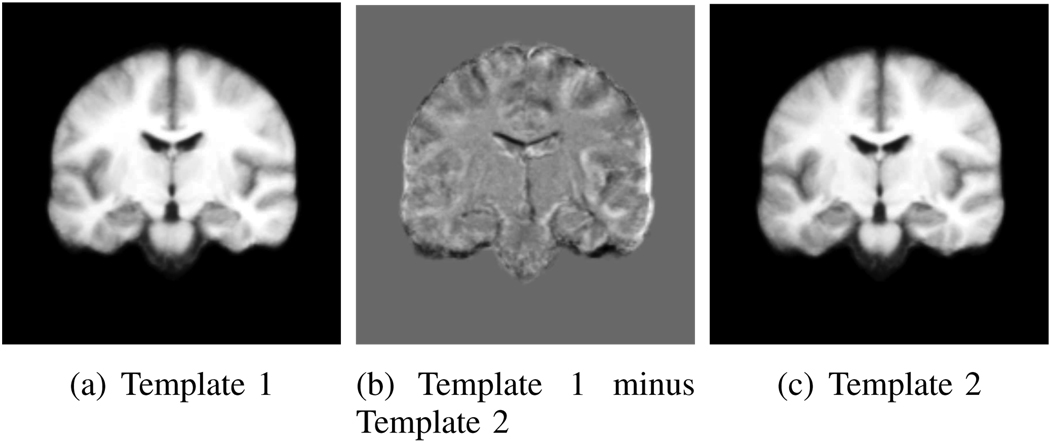
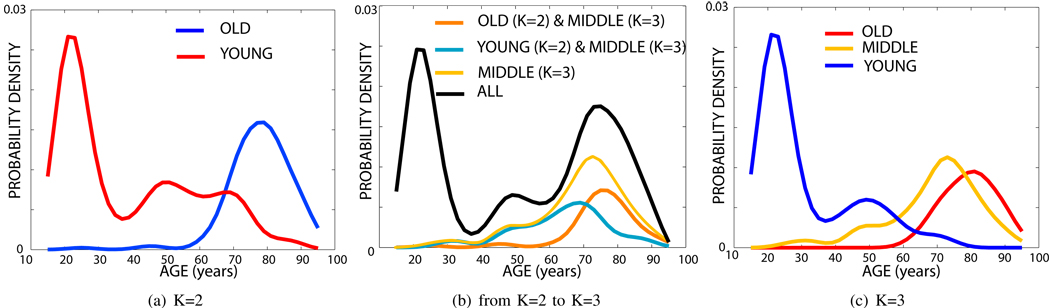
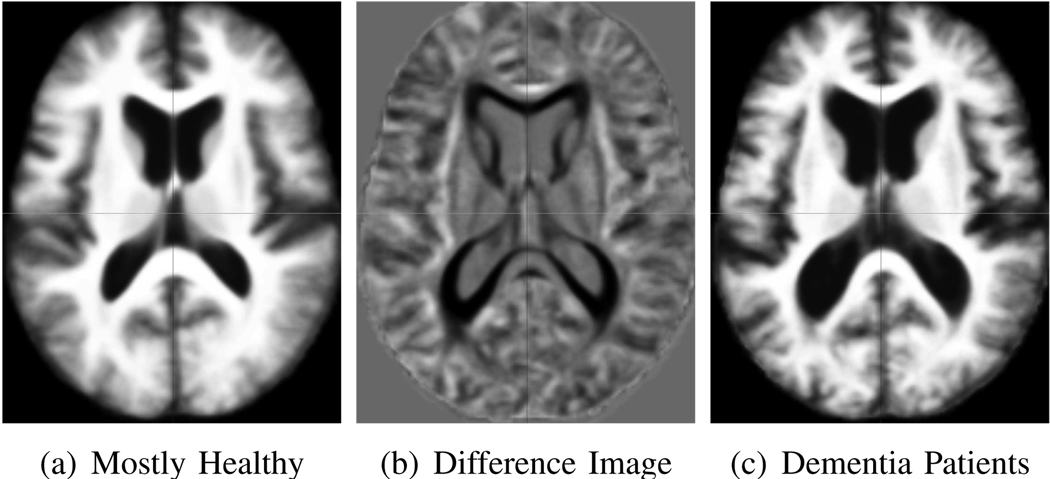
We present iCluster, a fast and efficient algorithm that clusters a set of images while co-registering them using a parameterized, nonlinear transformation model. The output of the algorithm is a small number of template images that represent different modes in a population. This is in contrast with traditional, hypothesis-driven computational anatomy approaches that assume a single template to construct an atlas. We derive the algorithm based on a generative model of an image population as a mixture of deformable template images. We validate and explore our method in four experiments. In the first experiment, we use synthetic data to explore the behavior of the algorithm and inform a design choice on parameter settings. In the second experiment, we demonstrate the utility of having multiple atlases for the application of localizing temporal lobe brain structures in a pool of subjects that contains healthy controls and schizophrenia patients. Next, we employ iCluster to partition a data set of 415 whole brain MR volumes of subjects aged 18 through 96 years into three anatomical subgroups. Our analysis suggests that these subgroups mainly correspond to age groups. The templates reveal significant structural differences across these age groups that confirm previous findings in aging research. In the final experiment, we run iCluster on a group of 15 patients with dementia and 15 age-matched healthy controls. The algorithm produces two modes, one of which contains dementia patients only. These results suggest that the algorithm can be used to discover subpopulations that correspond to interesting structural or functional "modes."
Figures


Similar articles
-
Discovering modes of an image population through mixture modeling.Med Image Comput Comput Assist Interv. 2008;11(Pt 2):381-9. doi: 10.1007/978-3-540-85990-1_46. Med Image Comput Comput Assist Interv. 2008. PMID: 18982628 Free PMC article.
-
Multi-atlas segmentation of the whole hippocampus and subfields using multiple automatically generated templates.Neuroimage. 2014 Nov 1;101:494-512. doi: 10.1016/j.neuroimage.2014.04.054. Epub 2014 Apr 29. Neuroimage. 2014. PMID: 24784800
-
Unsupervised segmentation, clustering, and groupwise registration of heterogeneous populations of brain MR images.IEEE Trans Med Imaging. 2014 Feb;33(2):201-24. doi: 10.1109/TMI.2013.2270114. Epub 2013 Jun 19. IEEE Trans Med Imaging. 2014. PMID: 23797244
-
Regional deficits in brain volume in schizophrenia: a meta-analysis of voxel-based morphometry studies.Am J Psychiatry. 2005 Dec;162(12):2233-45. doi: 10.1176/appi.ajp.162.12.2233. Am J Psychiatry. 2005. PMID: 16330585 Review.
-
Brain templates and atlases.Neuroimage. 2012 Aug 15;62(2):911-22. doi: 10.1016/j.neuroimage.2012.01.024. Epub 2012 Jan 10. Neuroimage. 2012. PMID: 22248580 Review.
Cited by
-
Learning task-optimal registration cost functions for localizing cytoarchitecture and function in the cerebral cortex.IEEE Trans Med Imaging. 2010 Jul;29(7):1424-41. doi: 10.1109/TMI.2010.2049497. Epub 2010 Jun 7. IEEE Trans Med Imaging. 2010. PMID: 20529736 Free PMC article.
-
A generative model for image segmentation based on label fusion.IEEE Trans Med Imaging. 2010 Oct;29(10):1714-29. doi: 10.1109/TMI.2010.2050897. Epub 2010 Jun 17. IEEE Trans Med Imaging. 2010. PMID: 20562040 Free PMC article.
-
SharpMean: groupwise registration guided by sharp mean image and tree-based registration.Neuroimage. 2011 Jun 15;56(4):1968-81. doi: 10.1016/j.neuroimage.2011.03.050. Epub 2011 Apr 2. Neuroimage. 2011. PMID: 21440646 Free PMC article.
-
A Kalman Filtering Perspective for Multiatlas Segmentation.SIAM J Imaging Sci. 2015;8(2):1007-1029. doi: 10.1137/130933423. Epub 2015 Apr 30. SIAM J Imaging Sci. 2015. PMID: 26807162 Free PMC article.
-
Robust Atlas-Based Segmentation of Highly Variable Anatomy: Left Atrium Segmentation.Stat Atlases Comput Models Heart. 2010;6364:85-94. doi: 10.1007/978-3-642-15835-3_9. Stat Atlases Comput Models Heart. 2010. PMID: 26090522 Free PMC article.
References
-
- Allassonniere A, Amit Y, Trouve A. Towards a coherent statistical framework for dense deformable template estimation. Journal of the Royal Statistical Society: Series B. 2007;69:3–29.
-
- Viola P, Wells WM. Alignment by maximization of mutual information. International Journal of Computer Vision. 1997;24(2):137–154.
-
- Ashburner J, Friston K. Unified segmentation. NeuroImage. 2005;26:839–851. - PubMed
-
- Ashburner J, Friston KJ. Voxel-based morphometry - the methods. NeuroImage. 2000;11:805–821. - PubMed
Publication types
MeSH terms
Grants and funding
- P41-RR13218/RR/NCRR NIH HHS/United States
- R01 MH050740/MH/NIMH NIH HHS/United States
- R01-NS051826/NS/NINDS NIH HHS/United States
- P41 RR013218-03/RR/NCRR NIH HHS/United States
- R01 MH050740-10/MH/NIMH NIH HHS/United States
- U24 RR021382-03/RR/NCRR NIH HHS/United States
- P41 RR013218-010008/RR/NCRR NIH HHS/United States
- U54 EB005149-01/EB/NIBIB NIH HHS/United States
- U24 RR021382/RR/NCRR NIH HHS/United States
- U54 EB005149-050001/EB/NIBIB NIH HHS/United States
- U24 RR021382-02/RR/NCRR NIH HHS/United States
- U54 EB005149-050012/EB/NIBIB NIH HHS/United States
- 5R01-MH050740-13/MH/NIMH NIH HHS/United States
- U54 EB005149/EB/NIBIB NIH HHS/United States
- R01 NS051826-03/NS/NINDS NIH HHS/United States
- U54-EB005149/EB/NIBIB NIH HHS/United States
- R01 NS051826/NS/NINDS NIH HHS/United States
- U54 EB005149-03/EB/NIBIB NIH HHS/United States
- P41 RR013218/RR/NCRR NIH HHS/United States
- R01 NS051826-02/NS/NINDS NIH HHS/United States
- U24-RR021382/RR/NCRR NIH HHS/United States
- R01 MH050740-13/MH/NIMH NIH HHS/United States
- P41 RR013218-09/RR/NCRR NIH HHS/United States
LinkOut - more resources
Full Text Sources
Other Literature Sources
Medical
