. 2009 Nov 15;57(15):1588-99.
doi: 10.1002/glia.20872.

Altered functional properties of satellite glial cells in compressed spinal ganglia

Affiliations

Altered functional properties of satellite glial cells in compressed spinal ganglia

Haijun Zhang et al. Glia. .

Abstract

The cell bodies of sensory neurons in the dorsal root ganglion (DRG) are enveloped by satellite glial cells (SGCs). In an animal model of intervertebral foraminal stenosis and low-back pain, a chronic compression of the DRG (CCD) increases the excitability of neuronal cell bodies in the compressed ganglion. The morphological and electrophysiological properties of SGCs were investigated in both CCD and uninjured, control lumbar DRGs. SGCs responded within 12 h of the onset of CCD as indicated by an increased expression of glial fibrillary acidic protein (GFAP) in the compressed DRG but to lesser extent in neighboring or contralateral DRGs. Within 1 week, coupling through gap junctions between SGCs was significantly enhanced in the compressed ganglion. Under whole-cell patch clamp recordings, inward and outward potassium currents, but not sodium currents, were detected in individual SGCs. SGCs enveloping differently sized neurons had similar electrophysiological properties. SGCs in the compressed vs. control DRG exhibited significantly reduced inwardly rectifying potassium currents (Kir), increased input resistances and positively shifted resting membrane potentials. The reduction in Kir was greater for nociceptive medium-sized neurons compared to non-nociceptive neurons. Kir currents of SGCs around spontaneously active neurons were significantly reduced 1 day after compression but recovered by 7 days. These data demonstrate rapid alterations in glial membrane currents and GFAP expression in close temporal association with the development of neuronal hyperexcitability in the CCD model of neuropathic pain. However, these alterations are not fully sustained and suggest other mechanisms for the maintenance of the hyperexcitable state.


Figures

Figure 1
Figure 1
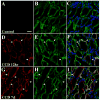
Triple labeling of GFAP, GS and nuclei in the control and compressed DRG. A, D, G. Upregulation of GFAP in SGCs after CCD. GFAP-IR (red) was absent in control DRGs (A) but was observed in the compressed DRG as early as 12 hrs after CCD (D, arrows), and peaked at about 7 days after CCD (G, arrows). B, E, H. GS (green) was expressed in all conditions as a marker for SGCs. C, F, I. Merges of GFAP, GS and a bisbenzimide (blue) stain for the nuclei of SGCs and neurons. The cell bodies (nuclei) for some GFAP-IR positive SGCs are marked with arrows. Scale bar = 40 μm.
Figure 2
Figure 2
Time course of GFAP expression in the compressed DRG. A. GFAP-IR was absent in DRGs of naïve animals (control) and 6 hours after CCD but appeared as early as 12 hours after the onset of compression. The mean number of GFAP-IR positive SGCs per mm2 area of section (±SEM) reached a peak at 7 days thereafter decreasing during the next two weeks. B. The mean number (±SEM) of all SGCs in control and compressed DRGs (7 days after CCD), and GFAP positive SGCs (“GFAP+ SGCs”) in compressed DRGs associated with neuronal cell bodies of different size categories. In both control and compressed DRGs, the number of SGCs (total and GFAP positive) increased significantly with the size of the neuronal soma. The number of SGCs associated with each size category of neurons did not differ between control and CCD ganglia.
Figure 3
Figure 3
Effects of CCD on coupling between SGCs. A, C, E. SGC patch-clamped, each on a different neuronal soma, and viewed under differential interference contrast. B, D, F. The same SGC now filled with Lucifer Yellow fluorescent dye from the pipette and viewed under epifluorescence. Most SGCs of control neurons were not coupled (B) or were coupled only to one other, adjacent, SGC on the same neuron (D) but never to one on another neuron. In contrast, after CCD by POD7, multiple SGCs around the same neuron were coupled together as viewed in F and at successively deeper planes through the neuron in steps of 10 um (G and H). For this neuron, 8 SGCs were coupled together. I. The time course of coupling in SGCs per neuron after CCD. The incidence of coupling increased significantly on CCD7 (p < 0.01) and increased but comparable to the control on CCD3 and CCD14 (p = 0.9 and 0.4, respectively). The incidence of coupling on CCD14 is similar to that on CCD3 (p = 0.4). J. The mean number of coupled SGCs (beyond the original one that was patch-clamped) per neuron was significantly increased from POD3 compared to control and significantly decreased from POD7 to POD14. (n= 8, 9, 6, 25, 15 for control, POD1, POD3, POD7 and POD14, respectively. * P < 0.05, Truncated Poisson distribution)
Figure 4
Figure 4
Effects of CCD, and a gap junctional blocker, carbenoxolone, on whole-cell currents in SGCs. A. Under voltage clamp, inward and outward currents were evoked in an uncoupled control SGC by depolarizing and hyperpolarizing voltage steps from a holding potential of −80 mV (inset). The typical responses of control SGCs consisted of time- and voltage-dependent currents, particularly during very negative voltage steps. B. Responses of a SGC to the same voltage steps on POD7 after CCD. Note the high degree of coupling between SGCs (inset) resulting in passive and non-inactivating currents. C. Current-voltage relationship, obtained by plotting the peak currents at each voltage in A and B. The relationship exhibited a slight rectification of inward currents for the control SGC (n=28, inset, the same I-V curve in C except only data of control SGCs was presented) but was nearly linear for the coupled CCD SGC (n=25). D–F. Responses to the same voltage steps of two other SGCs, one control and the other 7 days, after CCD, recorded in the presence of carbenoxolone. Note the absence of coupling, due to the blocker, in CCD SGCs (E, inset). Both control- (D) and CCD-SGCs (E) exhibited time- and voltage-dependent currents under carbenoxolone. Note the effects of CCD in decreasing both inward and outward currents of SGCs in control (n=32) and CCD7 (n=33) (F). Note differences in vertical scale in C and F.
Figure 5
Figure 5
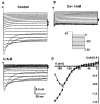
Effect of Cs+ on inwardly rectifying K+ currents (Kir) in a single (non-coupled) SGC from a control DRG in the presence of carbenoxolone. A. Whole-cell inward currents recorded in response to voltage steps of −180 to 0 mV each delivered following a pre-pulse to +40 mV (inset). B. Bath application of Cs+ (1 mM) blocked inward currents while leaving outward currents intact. C. Cs+-sensitive Kir currents were obtained by subtracting traces recorded in B from those in A. D. Current-voltage relationship obtained by plotting the peak Cs+-sensitive currents (circles) and the steady-state currents, taken at the end of each voltage step (triangles) against command voltages from traces in C. The Kir currents displayed a typical inactivation at voltages more negative than −150 mV.
Figure 6
Figure 6
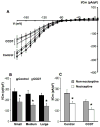
Effect of CCD on peak Kir currents in SGCs encircling small, medium and large sized neurons at POD7 (“CCD7”). A. Kir currents of SGCs associated with different sized neurons in control and CCD neurons recorded at POD7 (“CCD7”). Currents were obtained in response to membrane potentials of −180 to 0 mV. SGCs associated with small, medium and large neurons (square, circle, and triangle, respectively) had similar densities of Kir currents in either control or CCD7 ganglia (closed and open symbols, respectively). For neurons of each size category, SGCs had significantly reduced Kir currents 7 days after onset of CCD. B. Mean peak Kir currents obtained in response to depolarizations to −180 mV for small- (n=10 and 10 for control and CCD7), medium- (n=12 and 11 for control and CCD7), and large-sized (n=10 and 12 for control and CCD7) neurons. C. At −180 mV, SGCs encircling non-nociceptive neurons (n= 12 and 20 for control and CCD7) exhibited a higher density of Kir current than those associated with nociceptive neurons (n=15 and 14 for control and CCD7) in either control- or CCD7 ganglia (* P < 0.01, student’s t-test).
Figure 7
Figure 7
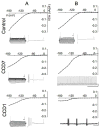
Representative recordings of Kir currents from SGCs (upper panel) and action potentials (AP) from their associated neurons (lower panel) in control, CCD7 and CCD1 ganglia. For each neuron, a continuous recording was obtained intracellularly for 2 min, without the delivery of any external stimulus, to detect the presence of ongoing, spontaneous discharges (SA). The neurons were classified as spontaneously active (SA) if spontaneous discharges persisted during this period (B in CCD7 and CCD1, lower panel), or categorized as silent. For silent neurons, a series of 200-ms depolarizing currents from −0.5 nA to 3 nA in increments of 0.05 nA was injected to induce APs (left lower panel in column A and control B). The current threshold (CT) was defined as the minimal current required to evoke an AP. Repetitive discharges of each neuron were measured by counting the spikes evoked by injection of a 1-s depolarizing current at 2.5 times of CT (right lower panel in column A and control B). Scale bar is 100 ms in CCD7 B and 1 s in CCD1 B, otherwise is 10 ms and 20 mV.
Figure 8
Figure 8
Kir currents of SGCs associated with non-nociceptive, medium-sized neurons. A. Kir currents were significantly reduced in CCD1 ganglia (n=21) but recovered after 7 days (CCD7, n=30). B. SGCs associated with spontaneously active (SA) neurons in CCD1 ganglia (n=9) had significantly decreased Kir currents at −180 mV but comparable Kir currents in CCD7 ganglia (n=10) when compared to those of silent neurons in control (n= 12, p < 0.01, student’s t-test). SGCs associated with SA neurons have less Kir currents in CCD1 ganglia but more currents in CCD7 ganglia when compared to SGCs associated with silent neurons (* P < 0.01, student’s t-test, n= 12 and 20 for SGCs associated with silent neurons in CCD1 and CCD7, respectively).

Similar articles

Cited by

References

    1. Anderson LC, von Bartheld CS, Byers MR. NGF depletion reduces ipsilateral and contralateral trigeminal satellite cell reactions after inferior alveolar nerve injury in adult rats. Exp Neurol. 1998;150:312–320. - PubMed
    1. Baker MD, Ritchie JM. Characteristics of type I and type II K+ channels in rabbit and Schwann cells. J Physiol. 1996;490:79–95. - PMC - PubMed
    1. Barres BA, Chun LL, Corey DP. Ion channels in vertebrate glia. Annu Rev Neurosci. 1990;13:441–474. - PubMed
    1. Barres BA. Glia ion channels. Curr Opin Neurobiol. 1991;1:354–359. - PubMed
    1. Bordey A, Lyons SA, Hablitz JJ, Sontheimer H. Electrophysiological characteristics of reactive astrocytes in experimental cortical dysplasia. J Neurophysiol. 2001;85:1719–1731. - PubMed

Publication types

MeSH terms

LinkOut - more resources