. 2009 Mar 27;33(6):679-91.
doi: 10.1016/j.molcel.2009.02.017.

BAX inhibitor-1 is a negative regulator of the ER stress sensor IRE1alpha

Affiliations

BAX inhibitor-1 is a negative regulator of the ER stress sensor IRE1alpha

Fernanda Lisbona et al. Mol Cell. .

Abstract

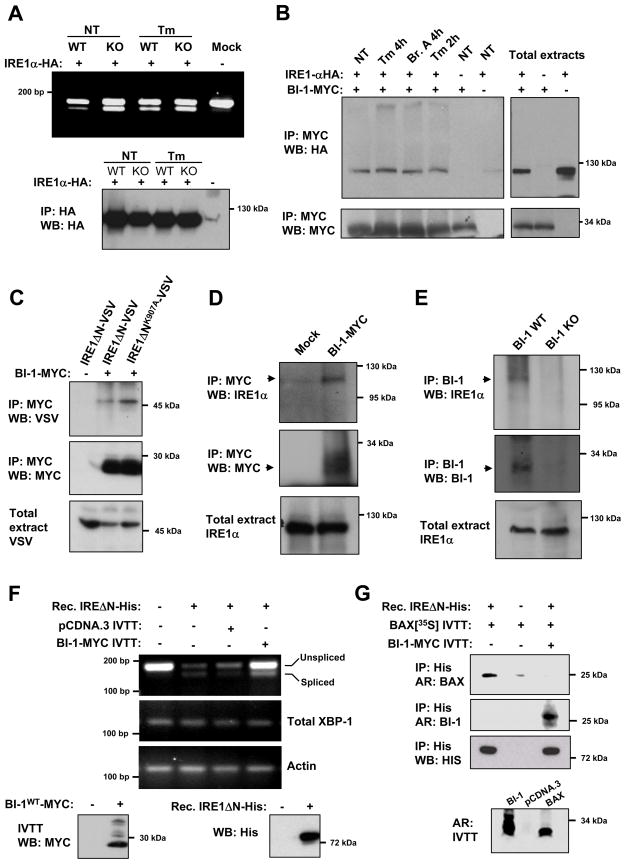
Adaptation to endoplasmic reticulum (ER) stress depends on the activation of an integrated signal transduction pathway known as the unfolded protein response (UPR). Bax inhibitor-1 (BI-1) is an evolutionarily conserved ER-resident protein that suppresses cell death. Here we have investigated the role of BI-1 in the UPR. BI-1 expression suppressed IRE1alpha activity in fly and mouse models of ER stress. BI-1-deficient cells displayed hyperactivation of the ER stress sensor IRE1alpha, leading to increased levels of its downstream target X-box-binding protein-1 (XBP-1) and upregulation of UPR target genes. This phenotype was associated with the formation of a stable protein complex between BI-1 and IRE1alpha, decreasing its ribonuclease activity. Finally, BI-1 deficiency increased the secretory activity of primary B cells, a phenomenon regulated by XBP-1. Our results suggest a role for BI-1 in early adaptive responses against ER stress that contrasts with its known downstream function in apoptosis.


Figures

Figure 1
Figure 1. BI-1 negatively regulates IRE1α signaling
(A)BI-1 KO and control MEFs were treated with indicated concentrations of Tm for 2.5 h and levels of XBP-1 mRNA splicing were determined in total cDNA by RT-PCR. Spliced and unspliced PCR fragments are indicated. In addition, total levels of XBP-1, spliced XBP-1 and actin mRNA were determined using RT-PCR. (B) BI-1 KO and control MEFs were treated with indicated concentrations of Tm for 2.5h and levels of XBP-1 mRNA splicing determined. Data presented are representative of at least ten independent experiments (C) BAX and BAK DKO MEFs were reconstituted with a BAK retroviral expression vector or empty vector (mock). After 48 h the levels of XBP-1 splicing were determined after treatment with indicated concentrations of Tm. Data is representative of 3 independent experiments. (D) BI-1 WT and KO cells were treated with 100 ng/ml Tm for indicated time points, and the levels of XBP-1s were determined in nuclear extracts by Western blot analysis. The levels of SP-1 were used as internal control. (E) In parallel, BI-1 WT and KO cells were treated with indicated concentrations of Tm for 4h and then the expression levels of XBP-1s, ATF4 and SP1 were determined in nuclear extracts. In addition the levels of phospho-eIF2α, and eIF2α were determined by Western blot in total cell extracts. (F) BI-1 KO MEFs were reconstituted with a retroviral expression vector encoding a BI-1WT-EGFP fusion protein (BI-1) and then XBP-1 mRNA splicing measured by RT-PCR after treatment with different doses of Tm for 2.5 h. C: Control BI-1 KO cells. Left panel: BI-1-EGFP and HSP90 expression were determined by Western blot. (G) WT MEFs were transduced with lentiviral vectors expressing shRNA against the bi-1 (shBI-1) or luciferase (shLuc) mRNA and levels of XBP-1 mRNA splicing determined by RT-PCR in cells treated with 100 ng/ml Tm for 2.5 h. As control, total BI-1 mRNA levels were determined by real time PCR. Mean and standard deviation are presented. p value was calculated using student’s t-Test. (H) In parallel, BAX and BAK DKO cells were transduced with shRNA against BI-1 mRNA or luciferase (Luc) and analyzed as described in (G).
Figure 2
Figure 2. Increased UPR responses in BI-1 deficient cells
(A) BI-1 WT and KO MEFs were treated with indicated concentrations of Tm for 8h and the mRNA levels of the XBP-1 target genes Sec61 and EDEM were determined by real-time PCR. (B) A panel of UPR target genes was analyzed by real time PCR in BI-1 WT and KO cells treated with 100 ng/ml of Tm for 8h. p values were calculated with t-student test comparing BI-1 WT and KO cells treated with Tm (*: p = 0.05, **: p = 0.01, ***: p <0.001). (C) As control, the mRNA levels of EDEM were determined in BI-1 KO cells expressing shRNA against XBP-1 or control shRNA (luciferase). (D) The mRNA levels of EDEM, Sec61, and HERP were determined at indicated time points in cells treated with 100 ng/ml Tm. In A and B p values were calculated by two-way anova to compare the effects of BI-1 ablation on UPR target gene upregulation. In experiments A-D data represents average and standard deviation representative of three experiments.
Figure 3
Figure 3. Delayed inactivation of XBP-1 mRNA splicing in BI-1 deficient cells
(A) Lower panel: XBP-1 mRNA splicing was monitored over time in BI-1 WT and KO cells treated with 100 ng/ml Tm. Upper panel: Quantification of the percentage of XBP-1 mRNA splicing was calculated after the densitometric analysis. (B) XBP-1 target genes edem and sec61 were evaluated in BI-1 WT and KO MEFs after 18h and 24h of treatment with 100 ng/ml Tm using real time PCR. p values were calculated by two-way anova to compare the effects of BI-1 ablation on UPR target gene upregulation. (C) BI-1 WT and KO cells were treated for 2h with 1 μg/ml of Tm and washed three times with PBS. Then, mRNA splicing was evaluated by RT-PCR during the recovery period at indicated time points. (D) BI-1 WT and KO cells were treated with 10 μg/ml of Tm for 3h to trigger complete XBP-1 mRNA splicing. Then cells were treated with 3 μg/ml actinomycin D to block transcription and the decay of XBP-1 mRNA was followed over time by real time PCR of total cDNA and normalized with the XBP-1 mRNA levels of control cultures not treated with actinomycin D.
Figure 4
Figure 4. BI-1 regulates pro-survival responses dependent on IRE1α/XBP-1
(A) BI-1 KO MEFs were stably transduced with lentiviral vectors expressing shRNA against the xbp-1, ireα (shXBP-1 and shIRE1α) or luciferase (shLuc) mRNA and levels of XBP-1s were determined by Western blot in total nuclear extracts. As controls, ATF4 and SP-1 levels were determined. (B) BI-1 WT and KO MEFs were stably transduced with lentiviral vectors expressing shRNA against the xbp-1 (shXBP-1) or luciferase (shLuc) mRNA and then treated with 0.1 or 1 μg/ml of Tm for 24h, and cell death was determined by PI staining and FACS analysis. (C) BI-1 KO shIRE1, shXBP-1 and shLuc cells were treated with indicated concentrations of Tm for 24h, and cell death was determined by PI staining and FACS analysis. (D) BI-1 KO cells transduced with indicated shRNA constructs were exposed to 0.1 μg/ml Tm, 40 μM etoposide, 50 ng/ml TNF-α together with 1 μg/ml actinomycin D or 10 μM taxol for 24 h and cell viability was analyzed by the MTS assay. Inset: The levels of XBP-1 splicing were assessed in WT MEFS after similar treatments for 3h. Average and standard deviations represent three determinations. * indicates p < 0.001 using student’s t-Test. (E) The levels of XBP-1 splicing (right panels) and cell death (left panels) were assessed in BCL-2 WT and KO MEFs, or MCL-1 WT and KO MEFs treated with indicated concentrations of Tm for 2.5 h (splicing) or 24 h (cell viability, PI staining and FACS analysis).
Figure 5
Figure 5. BI-1 forms a protein complex with IRE1α and regulates its endoribonuclease activity
(A) BI-1 WT and KO MEFs expressing HA-tag IRE1α (IRE1α-HA) were treated with 100 ng/ml Tm or left untreated. IRE1α-HA was immunoprecipitated (IP) and then incubated with total brain mRNA (substrate). After 30 min, mRNA was re-extracted and the levels of XBP-1 mRNA splicing were determined by RT-PCR. Bottom panel: the levels of IRE1α-HA expression were determined by Western blot of the immunoprecipitates. (B) 293T cells were co-transfected with expression vectors for BI-1-MYC and IRE1α-HA. After 48h cells were treated with 0.5 μg/ml Tm or 20 μM brefeldin A (Bref. A) for indicated time points and then the co-precipitation of MYC-BI-1 with IRE1α-HA was evaluated by immunoprecipitation and Western blot. (C) 293T cells were transfected with BI-1-MYC or an IRE1α inactive mutant (K907A) in the presence of VSV-tagged IRE1α lacking its ER luminal domain (IRE1ΔN-VSV) and then immunoprecipitation and Western blot analysis performed as in (B). (D) HEK cells were transiently transfected with a BI-1-MYC expression vector or empty pCDNA.3 vector. After 48h, BI-1-MYC was immunoprecipitated and its association with endogenous IRE1α was assessed by Western blot. (E) Endogenous BI-1 was immunoprecipitated from MEFs cells and its association with endogenous IRE1α was determined by Western blot analysis. As a control experiment, immunoprecipitation was performed from BI-1 KO cells. (F) The endoribonuclease activity of recombinant (rec.) IRE1ΔN-HIS was monitored in vitro using the conditions described in materials and methods. IVTT BI-1-MYC or control IVTT from empty vector (pCDNA.3) were pre-incubated with IRE1ΔN-HIS for 1h at 30°C and then total mRNA was added to the reaction and incubated for 1h. Then, the ribonuclease activity of IRE1α was analyzed by RT-PCR using regular XBP-1 mRNA splicing primers evidenced as decreased PCR product of the non-spliced fragment. Total XBP-1 mRNA and actin were monitored as control. Lower panel: Western blot analysis of IVTT BI-1-MYC and IRE1ΔN-HIS is shown. (G) IVTT BI-1 was incubated with recombinant IRE1ΔN-HIS in the presence or absence of IVTT BAX Met-35S labeled (upper panel). Then IRE1ΔN-HIS was pulled-down and its association with radiolabel BAX was determined by electrophoresis and autoradiograph (AR). As control, IRE1ΔN-HIS levels were determined by Western blot. To address the binding of BI-1 to IRE1, IVTT BI-1 Met-35S labeled was used with non-labeled BAX in the same experimental conditions. Bottom panel: Met-35S labeled BI-1, BAX or mock (pCDNA.3) were analyzed by electrophoresis and autoradiograph.
Figure 6
Figure 6. BI-1 regulates IRE1α through its cytosolic C-terminal region
(A) Amino acid sequence comparison of the C-terminal region of BI-1 from different species including BI-1 from human (hBI-1), mouse (mBI-1), Arabidopsis thaliana (aBI-1), Drosophila melanogaster (dBI-1) and the putative yeast homologue YN1305c. Predicted C-terminal cytosolic domain is highlighted with a gray square. (B) 293T cells were co-transfected with expression vectors for BI-1WT-MYC or BI-1C9A-MYC with IRE1α-HA (WT) or IRE1α deletion mutant of the cytosolic (ΔC), ER luminal domain (ΔN) or empty vector (m). After 48h cell extracts were prepared and HA-IRE1α was immunoprecipitated and interactions with BI-1 determined by Western blot. (C) BI-1 KO MEFs were reconstituted with expression vectors for EGFP fusion proteins of BI-1WT or BI-1ΔC and then XBP-1s mRNA levels measured by RT-PCR after treatment with different doses of Tm for 2.5 h. Right panel: BI-1 expression levels were analyzed by monitoring EGFP fluorescence by FACS. (D) IVTT BI-1WT-MYC and BI-1C9A-MYC labeled with Met-35S were incubated for 3h with recombinant IRE1ΔN-HIS. Then, IRE1ΔN-HIS was pulled-down and its association with radiolabel BI-1 was determined by electrophoresis and autoradiograph (AR). Bottom panel: Levels of radiolabel BI-1WT-MYC, BI-1C9A-MYC or mock (pCDNA.3) were compared by autoradiograph. (E) 293T cells were co-transfected with expression vectors for BI-1-MYC, and the VSV-cytosolic domain of IRE1α and after 48h BI-1-MYC was immunoprecipitated. Isolated protein complexes were incubated with increasing concentrations (10, 50 and 150 μM) of a synthetic peptide representing the C-terminal ten amino acids of BI-1 for 30 min, and IRE1α association with BI-1 measured by Western blot. (F) BI-1 WT and KO cells were treated with 10 μM BI-1C-ter peptide or control scrambled peptide for 2h, cells treated with 100 ng/ml Tm for indicated time points and levels of XBP-1 mRNA splicing were determined in total cDNA by RT-PCR. (G) WT MEFs were pre-treated with 10 μM BI-1C-ter peptide or scrambled peptide for 2h and then treated with 200 ng/ml tunicamycin or 0.2 μM brefeldin A for 2h or with 1 μg/ml tunicamycin as positive control. Then, the phosphorylation shift (P-IRE1) of endogenous IRE1α was monitored by Western blot. HSP90 levels were analyzed as loading control.
Figure 7
Figure 7. BI-1 regulates XBP-1 mRNA splicing in vivo and modulates IgM secretion in primary B cells
(A) BI-1 WT and BI-1 deficient mice were injected intraperitoneally with 0.2 μg Tm/g weight, and after 6 h of treatment animals were sacrificed and the expression levels of XBP-1s, ATF4 and SP1 (control) were determined by Western blot of nuclear extracts. (B) In parallel, expression of XBP-1s and HSP90 were determined in kidney total protein extracts from animals presented in (B). (C) WT or dBI-1 overexpressing D. melanogaster larva were grown in the presence or absence of 50 μg/ml Tm, 50 mM DTT or 10 μM thapsigargin for 20 h, and levels of XBP-1 splicing were determined by RT-PCR. As control, overexpression levels of dBI-1 mRNA and actin were measured by RT-PCR. Data is representative of three independent experiments. (D) Physiological model of ER stress: Primary B cells were purified from spleens of BI-1 WT and KO mice and then stimulated with the indicated concentration of LPS. After 2 days of culture, the levels of IgM were measured in the cell culture supernatant by ELISA. The values represent the results of the analysis of four different animals. * indicates p < 0.05 using student’s t-Test. (E) Splenic B cells from BI-1 WT and KO mice were cultured for 2 days in the presence of 0.1 μg/ml LPS, stained with brefeldin A-BODIPY, and then analyzed by FACS to determine relative content of ER and Golgi. (F) Cell surface levels of IgM and IgD were measured by FACS analysis of freshly isolated splenocytes from BI-1 WT and KO mice. Average percentages of IgD and IgM positive cells are indicated.

Comment in

Similar articles

Cited by

References

    1. Bailly-Maitre B, Fondevila C, Kaldas F, Droin N, Luciano F, Ricci JE, Croxton R, Krajewska M, Zapata JM, Kupiec-Weglinski JW, Farmer D, Reed JC. Cytoprotective gene bi-1 is required for intrinsic protection from endoplasmic reticulum stress and ischemia-reperfusion injury. Proc Natl Acad Sci U S A. 2006;103:2809–2814. - PMC - PubMed
    1. Bruey JM, Bruey-Sedano N, Luciano F, Zhai D, Balpai R, Xu C, Kress CL, Bailly-Maitre B, Li X, Osterman A, Matsuzawa S, Terskikh AV, Faustin B, Reed JC. Bcl-2 and Bcl-XL regulate proinflammatory caspase-1 activation by interaction with NALP1. Cell. 2007;129:45–56. - PubMed
    1. Calfon M, Zeng H, Urano F, Till JH, Hubbard SR, Harding HP, Clark SG, Ron D. IRE1 couples endoplasmic reticulum load to secretory capacity by processing the XBP-1 mRNA. Nature. 2002;415:92–96. - PubMed
    1. Chae HJ, Ke N, Kim HR, Chen S, Godzik A, Dickman M, Reed JC. Evolutionarily conserved cytoprotection provided by Bax Inhibitor-1 homologs from animals, plants, and yeast. Gene. 2003;323:101–113. - PubMed
    1. Chae HJ, Kim HR, Xu C, Bailly-Maitre B, Krajewska M, Krajewski S, Banares S, Cui J, Digicaylioglu M, Ke N, Kitada S, Monosov E, Thomas M, Kress CL, Babendure JR, Tsien RY, Lipton SA, Reed JC. BI-1 regulates an apoptosis pathway linked to endoplasmic reticulum stress. Mol Cell. 2004;15:355–366. - PubMed

Publication types

MeSH terms