. 2009 Sep 1;162(3):560-73.
doi: 10.1016/j.neuroscience.2009.02.082. Epub 2009 Mar 19.

Zic1 levels regulate mossy fiber neuron position and axon laterality choice in the ventral brain stem

Affiliations

Zic1 levels regulate mossy fiber neuron position and axon laterality choice in the ventral brain stem

H J Dipietrantonio et al. Neuroscience. .

Abstract

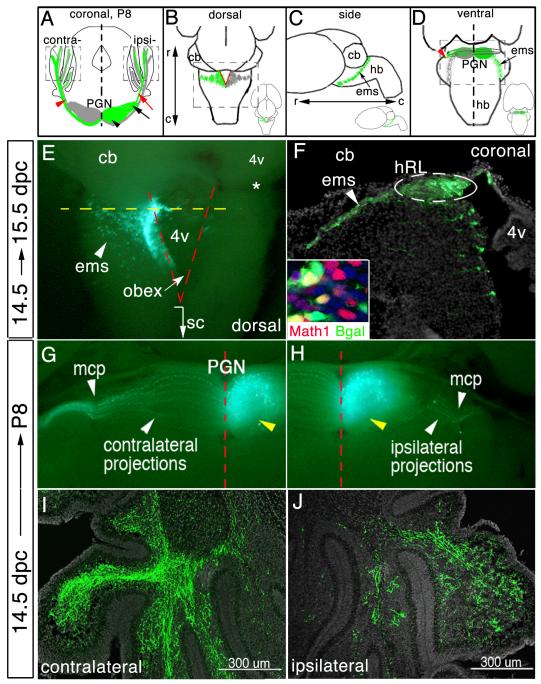
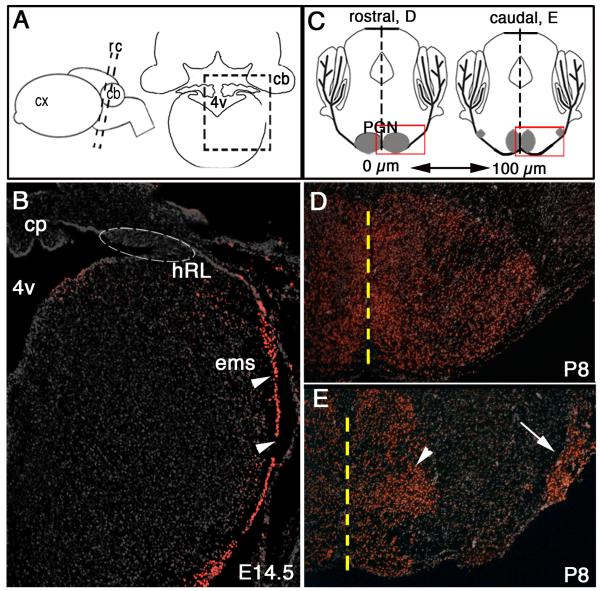
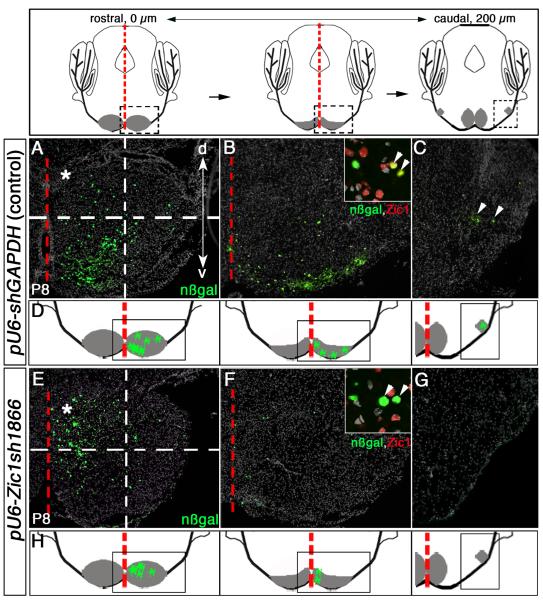
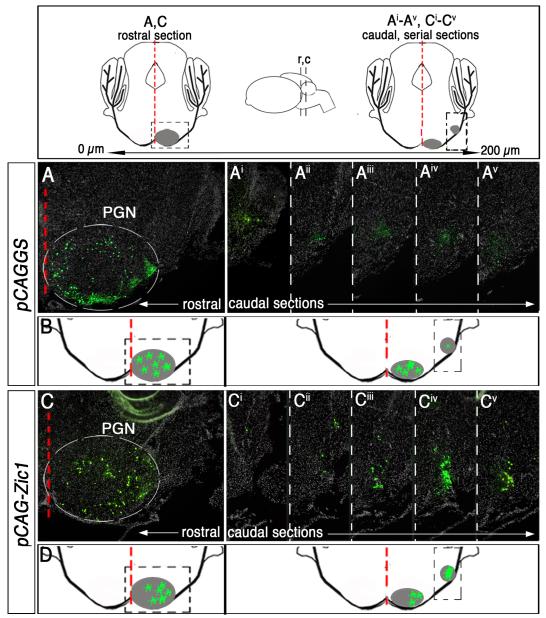
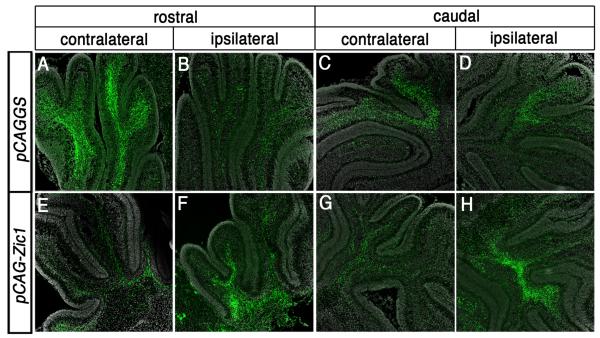
Pontine gray neurons of the brain stem are a major source of mossy fiber (MF) afferents to granule cells of the cerebellum. Achieving this connectivity involves an early regionalization of pontine gray neuron cell bodies within the brainstem pontine nuclei, as well as establishing the proper ratio of crossed versus uncrossed MF projections to contralateral versus ipsilateral cerebellar territories. Here, we report expression of the transcription factor Zic1 in newly postmitotic pontine gray neurons and present functional experiments in embryonic and postnatal mice that implicate Zic1 levels as a key determinant of pontine neuron cell body position within the pons and axon laterality. Reducing Zic1 levels embryonically via in utero electroporation of short hairpin RNA interference (shRNAi) vectors shifted the postnatal distribution of pontine neurons from caudolateral to rostromedial territories; by contrast, increasing Zic1 levels resulted in the reciprocal shift, with electroporated cells redistributing caudolaterally. Associated with the latter was a change in axon laterality, with a greater proportion of marked projections now targeting the ipsilateral instead of contralateral cerebellum. Zic1 levels in pontine gray neurons, therefore, play an important role in the development of pontocerebellar circuitry.


Figures

Fig.1
Fig.1
Visualizing development of a single lobe of the bilateral PGN. (A) Schematic of oblique coronal brain section. The PGN is comprised of rostromedial (black arrowhead) and caudolateral (black arrow) neuronal subpopulations on each side of the brain stem. Green marking represents eGFP/nßgal-transfected neurons and their axons. Most PGN neurons extend axons across brainstem midline toward the contralateral cerebellum (red arrowhead), whereas few project away from the midline toward the ipsilateral cerebellum (red arrow). Dashed boxes, “contra” and “ipsi”, identify area of cerebellar images in (I) and (J), respectively. (B-D) Whole brain schematics. Insets, low-power images of brains. PGN precursor cells emerge from the hRL (red lines) (B) and travel ventrally forming the extramural migratory stream (ems) (C). Postmitotic hRL precursor cells aggregate adjacent to the ventral brainstem midline to form the PGN, extending axons across or away from the midline (D). Dashed boxes in (B) and (D) identify area of images in (E), and (G,H), respectively. (E) Whole brain at 15.5 dpc that was electroporated at 14.5 dpc. eGFP-transfected mitotic cells within the hRL and postmitotic cells within the ems. Dashed yellow line in (E) identifies the ideal axial level of the coronal section in (F). Dashed red lines in (E) demarcate location of the left and right side of the hRL. eGFP+ cells form the ems (arrowhead) (E and F). (F) Immunodetection of eGFP on a high magnification coronal section shows transfected progenitor cells within one side of the hRL and their postmitotic progeny cells within the ems. Inset in (F), co-immunodetection for nßgal and Math1. (G,H) Ventral view of P8 brains that were electroporated at 14.5 dpc. eGFP fluorescence shows labeled cells in the ipsilateral lobe of the PGN (yellow arrowhead) and their contralateral (G) and ipsilateral (H) MF projections. Immunodetection of eGFP shows eGFP+ MF axons throughout the granule cell layer of the contralateral (I) and ipsilateral (J) cerebellum. DAPI staining to highlight cell bodies is shown in gray. r, rostral; c, caudal; cb, cerebellum; sc, spinal cord; 4v, fourth ventricle; mcp, medial cerebellar peduncle.
Fig. 2
Fig. 2
Zic1 expression in the postmitotic precerebellar MF lineage. (A) Schematic side view of a mouse brain (left) and a coronal section (right). Boxed area in (A) identifies region in (B). Black dashed lines demarcate idealized axial levels in (D) and (F). (B) Coronal section through the caudal hindbrain at 14.5 dpc showing Zic1+ cells throughout the ems (arrowheads); Zic1+ cells were not detected within progenitor cells of the hRL (located within dashed oval). (C) Schematics of oblique coronal P8 brain sections ~200 μm apart at the axial levels of the rostral (left) and caudal (right) pons, respectively. Boxed area in rostral section identifies region in (D), and boxed area in caudal section identifies region in (E). Black dashed lines demarcate the midline; the PGN is gray. In rostral PGN regions, neurons aggregate medially. Toward more caudal regions, the neurons scatter along the ventral surface and settle into medial (arrowhead) and lateral (arrow) subpopulations. (D,E) Immunodetection for Zic1 on coronal sections through the rostral (D) and caudal (G) PGN at P8 shows Zic1+ cells in medial and lateral populations. Yellow dashed line demarcates the midline. cx, cortex; cp, choroid plexus.
Fig. 3
Fig. 3
Knockdown of Zic1 in the pontine gray MF lineage leads to a shift in neuron distribution to rostromedial brainstem territories. Above, schematics of coronal sections along the rostrocaudal (RC) axis of the PGN at P8. Distance between rostral and caudal sections is ~200 μm; PGN is in gray. Red dashed line demarcates brainstem midline. Boxed area in the rostral schematic identifies neurons in rostromedial PGN in (A) and (E). Boxed area in the middle schematic identifies the PGN territory in (B) and (F). Boxed area in the caudal schematic identifies the caudolateral PGN territory in (C) and (G). (A-C) Immunodetection for nßgal on coronal sections of P8 control animals that were co-transfected with control (pU6-shGAPDH) and reporter vectors at 14.5 dpc. nßgal+ cells along the ventral periphery of the rostromedial (A and B) and caudolateral (C) PGN territories. Inset in (B), co-immunodetection of nßgal (green) and Zic1 (red) shows transfected cells in control animals express relatively high levels of Zic1 protein (arrowheads). (D) Summary schematics of findings from control conditions, showing cells transfected with control and reporter vectors as green markings distributed throughout the rostomedial and caudolateral PGN populations; the PGN is gray. (E-G) Coronal sections through the PGN of P8 animals co-transfected at 14.5 dpc with pU6-Zic1sh1866 and reporter vectors. Immunodetection for nßgal reveals transfected cells scattered primarily in the rostromedial portions of the PGN (E) and (F), with reduction of transfected cells settling in the caudolateral PGN (G). Inset in (F), co-immunodetection of nßgal (green) and Zic1 (red) shows that most transfected cells receiving the Zic1 shRNAi construct expressed little to no detectable levels of Zic1 protein, indicating that this shRNAi construct efficiently suppressed Zic1 protein levels (arrowheads). Dashed-line grids in (A) and (E) clarify distribution differences of transfected cells between control animals and Zic1 knockdown animals (upper left quadrants, asterisks). A significantly greater proportion of nßgal+ cells transfected with the Zic1 shRNAi construct settled in the rostromedial PGN as compared to control animals (student’s t-test, p<0.0001). (H) Summary schematics of findings from Zic1 shRNAi knockdown study, showing transfected cells distributed predominantly in the rostromdial PGN. d, dorsal; v, ventral.
Fig. 4
Fig. 4
Zic1 overexpression in cells of the precerebellar MF lineage leads to a redistribution of neurons to caudolateral territories. Above, schematics of coronal sections along the rostrocaudal axis of the PGN at P8. Inset (center) depicts side view of the brain, and black dashed lines indicate idealized axial levels of coronal sections to the left and right. Distance between rostral and caudal sections is ~200 μm; PGN is in gray. Red dashed line demarcates brainstem midline. Boxed area in the rostral schematic identifies neurons in rostromedial PGN in (A) and (C). Boxed area in the caudal schematic identifies region in caudolateral PGN (Ai-Av) and (Ci-Cv). (A and Ai-v) Immunodetection for nßgal highlights cells co-transfected with control vector (pCAGGS) and reporter vectors. Coronal section of the rostral PGN of a P8 animal that was electroporated at 14.5 dpc (B). Five serial sections of the caudal PGN (A-Av). (B) Summary schematic of labeled cells within the PGN of control animals. (C and Ci-v) Immunodetection for nßgal shows cells co-transfected with pCAG-Zic1 and reporter vectors. Coronal section of the rostral PGN (C). Five serial sections of the caudal PGN (C-Cv). A significantly greater proportion of nßgal+ cells (transfected with pCAG-Zic1) reside in caudolateral PGN as compared to control animals in (Ai-Av) (student’s t-test, p<0.0001). (D) Summary schematic of labeled cells that have shifted to caudolateral aspects of the PGN in Zic1 overexpression animals.
Fig. 5
Fig. 5
Increasing levels of Zic1 in the pontine MF neuron lineage promotes MF axon targeting to the ipsilateral instead of the usual contralateral cerebellum. (A-D) High magnification coronal images of cerebellar sections from P8 control animal that was electroporated at 14.5 dpc. Immunodetection for eGFP at the axial levels of the rostral (A,B) and caudal (C,D) cerebellum shows that a greater proportion of eGFP+ MF axons project throughout the forming granule cell layer of the contralateral cerebellum (A,C) rather than the ipsilateral cerebellum (B,D). (E-H) High magnification coronal images of cerebellar sections from Zic1 overexpression animals. By contrast to control animals, there is a greater proportion of eGFP+ MF axons within the ipsilateral cerebellum (F,H) in comparison to the contralateral cerebellum (E,G).
Fig. 6
Fig. 6
Schematic representation of proposed model of Zic1 action in postmitotic precerebellar MF neurons. Under normal conditions, MF neurons of the PGN reside throughout the rostrocaudal extent of the nucleus (right). Variations in Zic1 protein levels in MF neurons determines where in the PGN an individual MF neuron takes up residence and to which side of the cerebellum it projects. MF neurons in which Zic1 levels were reduced settled in rostromedial PGN territories and projected to contralateral target regions in the cerebellum (middle), whereas MF neurons in which Zic1 levels were increased settled in caudolateral PGN territories and projected to ipsilateral targets (right, asterisk).

Similar articles

Cited by

References

    1. Alcantara S, Ruiz M, De Castro F, Soriano E, Sotelo C. Netrin 1 acts as an attractive or as a repulsive cue for distinct migrating neurons during the development of the cerebellar system. Development. 2000;127:1359–72. - PubMed
    1. Altman J, Bayer S. Development of the cerebellar system: in relation to its evolution, structure, and functions. CRC Press; Boca Raton, Florida: 1997.
    1. Altman J, Bayer SA. Development of the precerebellar nuclei in the rat: III. The posterior precerebellar extramural migratory stream and the lateral reticular and external cuneate nuclei. J Comp Neurol. 1987a;257:513–28. - PubMed
    1. Altman J, Bayer SA. Development of the precerebellar nuclei in the rat: IV. The anterior precerebellar extramural migratory stream and the nucleus reticularis tegmenti pontis and the basal pontine gray. J Comp Neurol. 1987b;257:529–52. - PubMed
    1. Aruga J. The role of Zic genes in neural development. Mol Cell Neurosci. 2004;26:205–21. - PubMed

Publication types

MeSH terms