. 2009 Apr 1;182(7):4137-49.
doi: 10.4049/jimmunol.0803982.

Nitrated {alpha}-synuclein-induced alterations in microglial immunity are regulated by CD4+ T cell subsets

Affiliations

Nitrated {alpha}-synuclein-induced alterations in microglial immunity are regulated by CD4+ T cell subsets

Ashley D Reynolds et al. J Immunol. .

Abstract

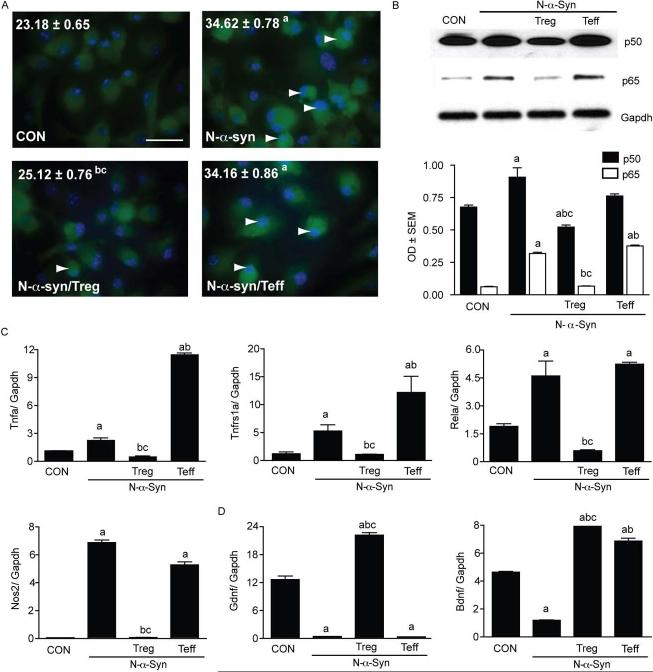
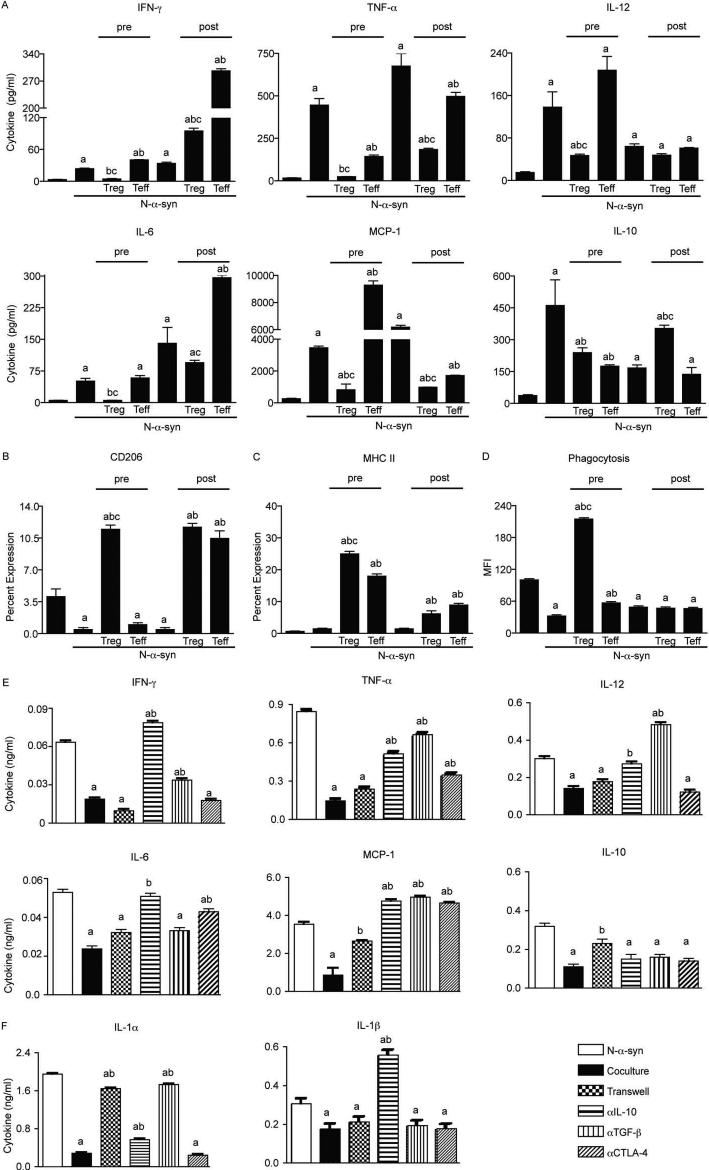
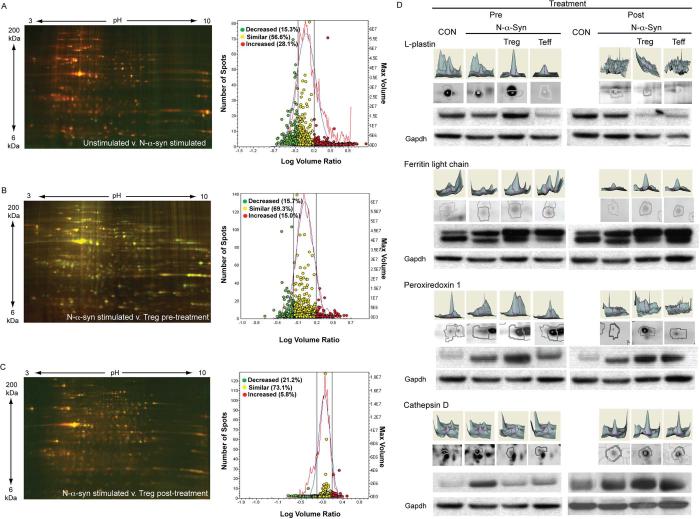
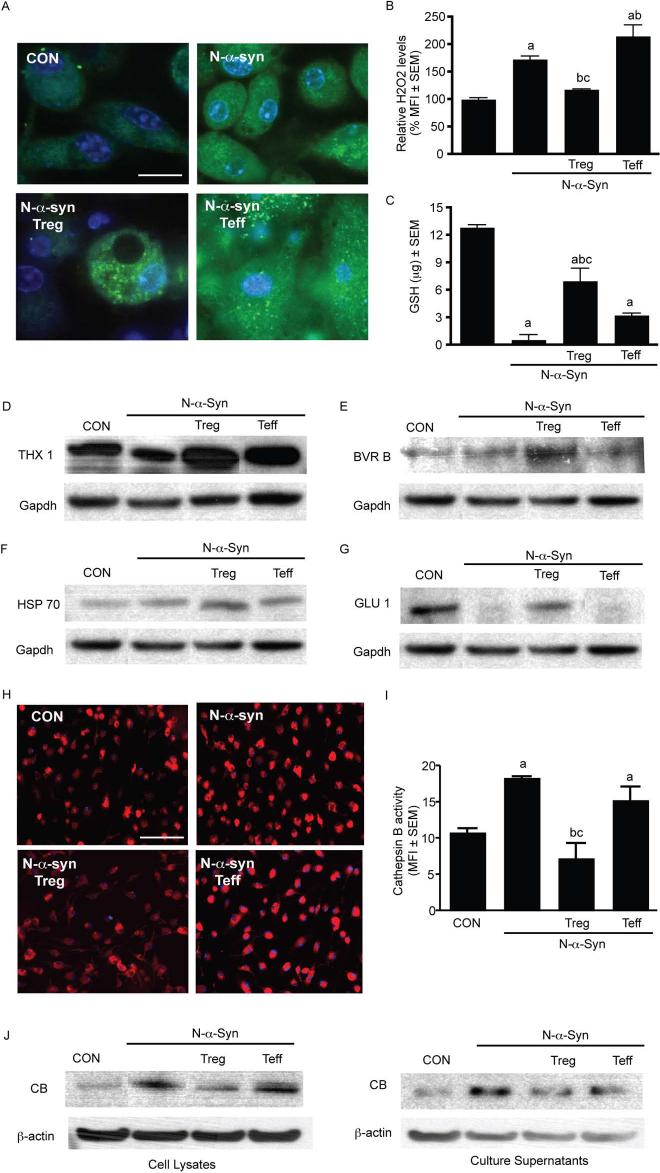
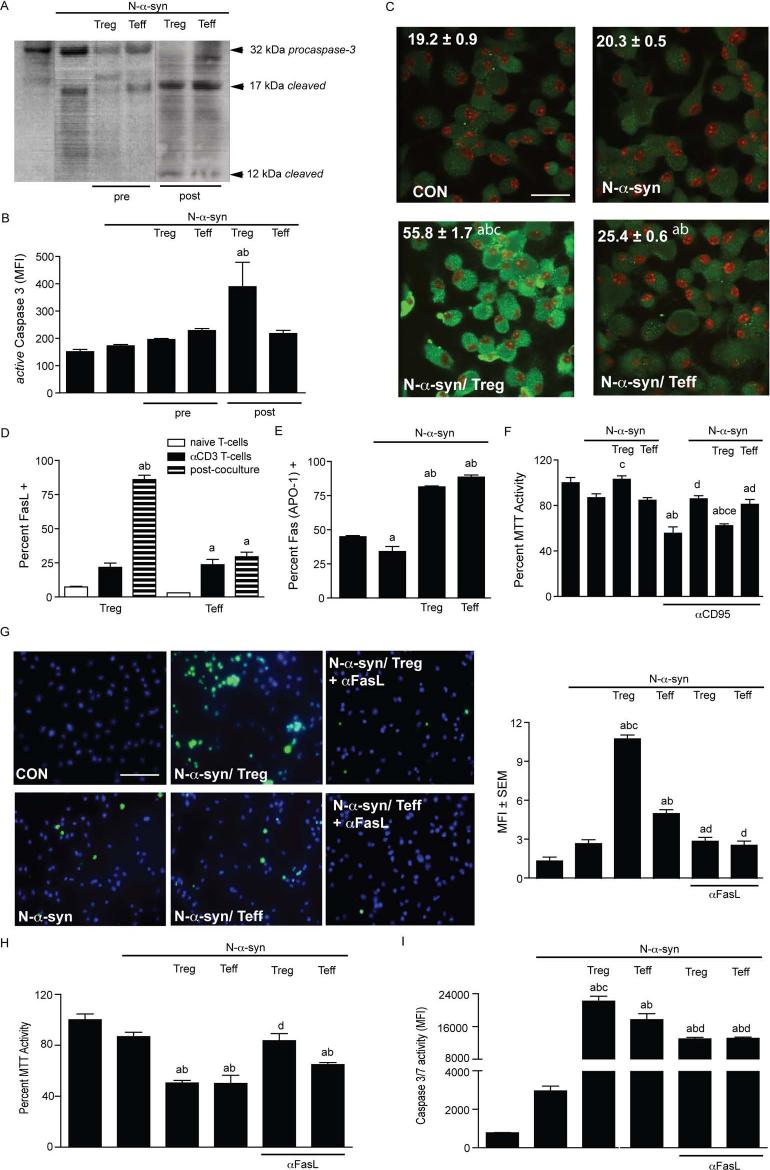
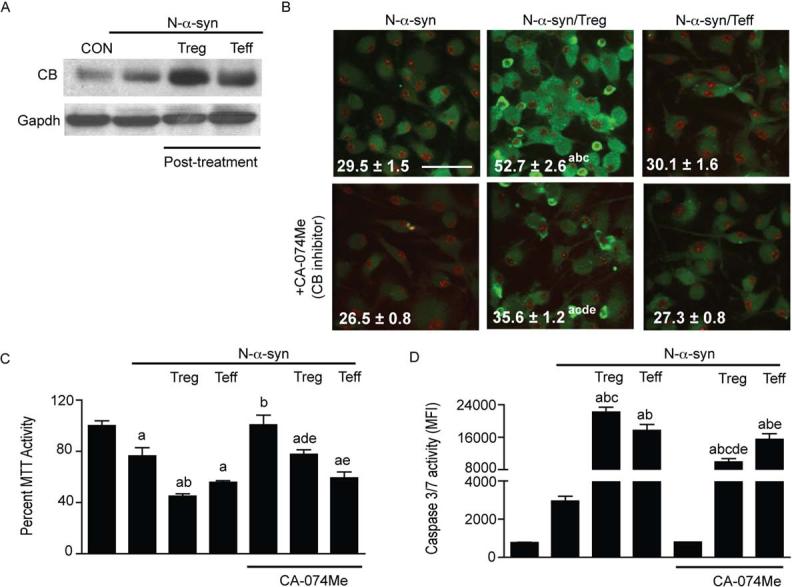
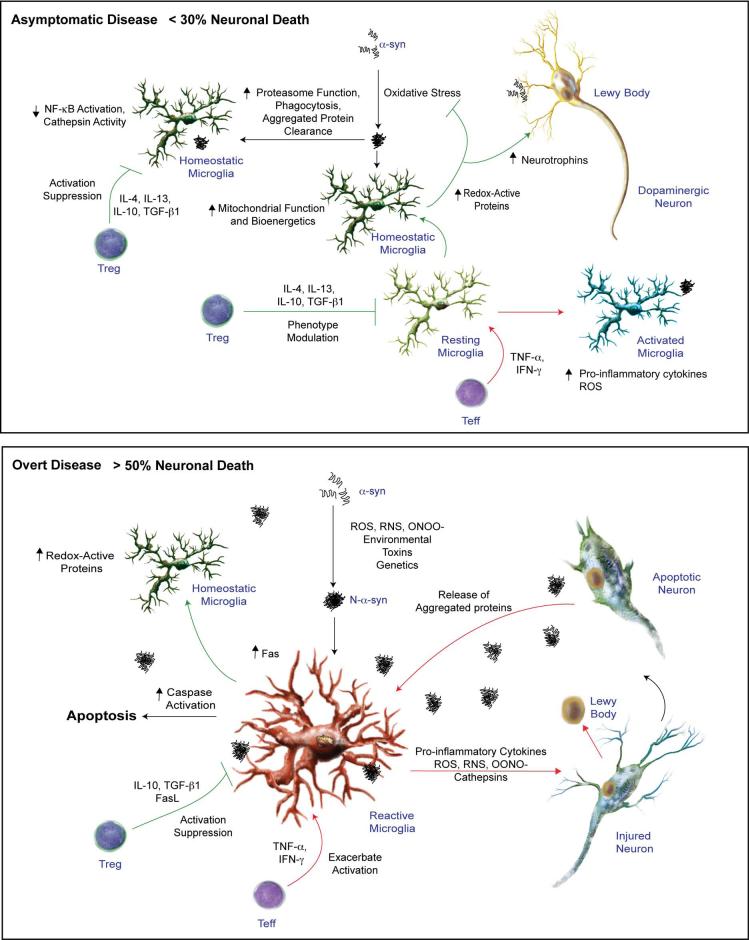
Microglial inflammatory neuroregulatory activities affect the tempo of nigrostriatal degeneration during Parkinson's disease (PD). Such activities are induced, in part, by misfolded, nitrated alpha-synuclein (N-alpha-syn) within Lewy bodies released from dying or dead dopaminergic neurons. Such pathobiological events initiate innate and adaptive immune responses affecting neurodegeneration. We posit that the neurobiological activities of activated microglia are affected by cell-protein and cell-cell contacts, in that microglial interactions with N-alpha-syn and CD4(+) T cells substantively alter the microglial proteome. This leads to alterations in cell homeostatic functions and disease. CD4(+)CD25(+) regulatory T cells suppress N-alpha-syn microglial-induced reactive oxygen species and NF-kappaB activation by modulating redox-active enzymes, cell migration, phagocytosis, and bioenergetic protein expression and cell function. In contrast, CD4(+)CD25(-) effector T cells exacerbate microglial inflammation and induce putative neurotoxic responses. These data support the importance of adaptive immunity in the regulation of Parkinson's disease-associated microglial inflammation.


Figures

FIGURE 1
FIGURE 1
CD4+ T cells modulate NF-κB activation in N-α-syn-stimulated microglia. Microglia were pretreated without or with CD4+ T cells and NF-κB activity was assessed following 90 min stimulation with N-α-syn. (A) Photomicrographs of immunofluorescent detection for NF-κB p65 in stimulated microglia (scale bar: 25 μm) and analysis for mean fluorescence intensity (MFI) per cell. Arrows indicate areas where co-localization of NF-κB p65 (green) and nuclei (blue) appears to have occurred. (B) Western blot analysis of nuclear fractions from stimulated microglia with antibodies to the NF-κB subunits p50/RELA (top), p65/NFκB1 (middle), or a control Gapdh antibody (bottom). Mean optical density (OD) was normalized to Gapdh expression. In addition, cDNA prepared from RNA isolated from duplicate samples was assessed by qPCR for expression of NF-κB related genes Tnfa, Tnfrs1a, Rela, Nos2 (C), and neurotrophins Bdnf and Gdnf (D). Mean expression levels shown were normalized to Gapdh expression. (B-C) Error bars represent SEM. (P < 0.05 compared to amedia alone (CON), bN-α-syn, or cN-α-syn/Teff).
FIGURE 2
FIGURE 2
Inhibition of proinflammatory cyto/chemokine production requires both cell contact and soluble factors. (A) Cyto/chemokine levels in microglial culture supernatants treated with media alone (CON), or N-α-syn without or with pre-treatment or post-treatment with CD3-activated Treg or Teff were measured by cytometric bead array. Microglia were also assessed by flow cytometry for surface expression of CD206 (B) and MHC class II (C). Alternatively, FITC-conjugated latex beads were added to the microglia cultures 30 min prior to flow cell analysis to evaluate phagocytosis by the mean fluorescence intensity (MFI) of microglia that phagocytized beads (D). [P < 0.05 compared to microglia cultured with amedia alone (CON), bN-α-syn, or cN-α-syn/Teff (panels A-D)]. Microglia were cultured without or with Treg either in direct contact or separated by transwells. Neutralizing antibodies to IL-10, TGF-β and CTLA-4 were added to tandem direct contact cultures of microglia without and with Treg. Cyto/chemokine concentrations (IFN-γ, TNF-α, IL-12, IL-6, MCP-1 and IL-10) in culture supernatants were determined by (E) cytometric bead array or (F) ELISArray (IL-1α and IL-1β). [P < 0.01 compared to microglia cultured with aN-α-syn or with bN-α-syn/Treg in direct contact (panels E and F)]. (A-E) Error bars represent SEM.
FIGURE 3
FIGURE 3
Analysis of microglial proteome. (A) Flourescence 2D DIGE and Decyder analysis of N-α-syn stimulated microglial cell lysates compared to unstimulated microglia. To assess phenotypic change following interaction with Treg, representative 2D gels and Decyder analysis was performed on microglial cell lysates assessing microglia co-cultured with CD3-activated Treg prior to stimulation with N-α-syn (B, pre-treatment) or added in tandem 12 h following the addition of N-α-syn to the cultures (C, post-treatment). (D) Western blots, and volumetric and area intensity plot analysis by BVA for select proteins identified by LC-MS/MS are shown for cell lysates of unstimulated, N-α-syn stimulated without or with pretreatment with Treg or Teff, and post-treatment with Treg or Teff: L-plastin [spot: 23], ferritin light chain [spot: 28], peroxiredoxin 1 [spot: 65], and cathepsin D [spot: 13] as shown in Fig. S2.
FIGURE 4
FIGURE 4
CD4+ T cells modulate microglial oxidative stress and cathepsin B activity. (A) Confocal photomicrographs of intracellular ROS production (green) in microglia after 90 min stimulation with media (CON) or N-α-syn without and with T cell pre-treatment (scale bar: 25 μm). (B) Mean fluorescence intensity (MFI) of ROS production per cell. (C) Microglial intracellular glutathione concentration following 24 h exposure to N-α-syn without and with T cell pre-treatment. [P < 0.01 compared to microglia cultured with amedia alone (CON), bN-α-syn, or cN-α-syn/Teff (panels B and C)]. Western blots of select redox-active proteins identified by LC-MS/MS including (D) thioredoxin (THX) 1 [spot: 49], (E) billiverdin reductase (BVR) B [spot: 34], (F) heat shock protein (HSP) 70 [spot: 3] and (G) glutaredoxin (GLU) 1 [spot: 64], as shown in Fig. S2. Cathepsin B (CB) activity (green) in microglia after stimulation with N-α-syn for 24 h is demonstrated by (H) fluorescence photomicrographs (scale bar: 25 μm) and (I) MFI analysis. [P < 0.05 compared with microglia cultured to amedia alone (CON), bN-α-syn, or cN-α-syn/Teff]. (J) Representative Western blot analysis of microglial lysates and culture supernatants for CB [spot: 27 (Fig. S2)] expression and re-probed with antibody against β-actin following pre-treatment with Treg or Teff and stimulation for 24 h with N-α-syn. (B, C, and I) Error bars represent SEM.
FIGURE 5
FIGURE 5
Treg induce microglial apoptosis through Fas-FasL interactions. (A) Western blot for caspase-3 (pro-caspase 3 and cleaved) expression in microglial cell lysates from unstimulated (lane 1), N-α-syn-stimulated alone (lane 2) or pre-treated with Treg or Teff (lanes 3 and 4) or post-treated with Treg or Teff (lanes 5 and 6). (B) Flow cell analysis for mean fluorescence intensity (MFI) of active caspase-3 expression by microglia. [P< 0.05 compared to amedia alone and bN-α-syn stimulation] (C) Confocal photomicrographs and MFI for active caspase-3 (green) on a per cell basis (scale bar: 25 μm). [P < 0.01 compared to microglia cultured in amedia alone (CON), bN-α-syn stimulation alone, or cN-α-syn/Teff]. (D) Flow cell analysis for FasL expression by Treg or Teff immediately following isolation (naïve T cells), following CD3-activation (αCD3 T cells), and after co-culture with N-α-syn stimulated microglia for 24 h (post-co-culture). Mean percentages of FasL+CD4+ T cells shown (P < 0.05 compared to anaive T cells and bαCD3 T cells). (E) Flow cell analysis of Fas expression by microglia treated for 24 h without and with N-α-syn stimulation and T cell post-treatment. Percentages of Fas+ cells are shown [P < 0.05 compared to amedia alone, bN-α-syn stimulation alone, and cN-α-syn/Teff]. (F) MTT assay to assess microglial susceptibility to spontaneous- and anti-CD95 induced apoptosis after culture for 24 h in media alone, N-α-syn without or with T cell pre-treatment. [P < 0.05 compared to amedia alone, bN-α-syn stimulation alone, cN-α-syn/Teff, dmedia alone with anti-CD95 stimulation, eN-α-syn with anti-CD95 stimulation]. (G) TUNEL assay of microglia treated with media (CON), N-α-syn without and with post-treatment with Treg or Teff in the absence or presence of anti-FasL. Photomicrographs (scale bar: 25 μm) and MFI of TUNEL+ cells (green) normalized to the number of DAPI-stained nuclei (blue). FasL dependence in Treg-induced apoptosis of stimulated microglia was also assessed by (H) MTT assay and (I) caspase 3/7 activity assays. Values shown as a percentage of unstimulated controls (MTT) or MFI (caspase-3/7 activity). [P < 0.05 compared to amedia alone, bN-α-syn stimulation alone, cN-α-syn/Teff, dpost-treatment without anti-FasL (panels G, H, and I)]. (B-I) Error bars represent SEM.
FIGURE 6
FIGURE 6
Cathepsin B regulates microglial apoptosis. (A) Western blot for cathepsin B (CB) and Gapdh expression in microglial cell lysates following treatment with media (CON), N-α-syn without and with Treg or Teff after N-α-syn stimulation (post-treatment). (B) Confocal photomicrographs (scale bar: 25 μm) and MFI per cell of active caspase 3 (green) expression in N-α-syn-stimulated microglia in the presence or absence of Treg or Teff in the absence or presence a cell permeable CB inhibitor [CA-074 Me]. The MTT assay (C) and caspase 3/7 activity assay (D) of microglia also revealed that inhibition of CB significantly diminished stimulation-induced apoptosis. Values shown are means (± SEM) of absorbance as a percentage of unstimulated controls (MTT) or MFI (caspase-3/7 activity). (P < 0.05 compared to amedia alone, bN-α-syn stimulation alone, cN-α-syn/Teff, dpost-treatment without CA-074Me, eN-α-syn with CA-074Me).
FIGURE 7
FIGURE 7
CD4+ T cells in the prevention and pathogenesis of PD prior to onset of symptoms and during overt disease. T cell-mediated immune surveillance has been proposed that may account for a neurotrophic phenotype of resident microglia. The neurotrophic capacity of microglia could be attributed to increased phagocytic and proteasomal function for efficient clearance of misfolded proteins, elevated buffering capacity for oxidative stress, and increased bioenergetics (top panel). At onset of disease due to environmental toxins, age-associated immune dysregulation, or genetic predisposition α-syn becomes aggregated and contributes to microglial activation. The resulting inflammatory cascade then contributes to protein nitration and further aggregation ultimately inciting adaptive immune responses that is associated with PD pathogenesis. A compensatory response attributed to increased regulatory T cell numbers and function ensues to curtail the ongoing inflammatory reaction within the brain and serves to slow disease progression through cell-mediated destruction of activated microglia or conversion back to a homeostatic phenotype (bottom panel). This response however is not sufficient to ameliorate disease, and therefore results in a slowly progressive disease that persists in a chronic state.

Similar articles

Cited by

References

    1. Duda JE, Giasson BI, Chen Q, Gur TL, Hurtig HI, Stern MB, Gollomp SM, Ischiropoulos H, Lee VM, Trojanowski JQ. Widespread nitration of pathological inclusions in neurodegenerative synucleinopathies. Am J Pathol. 2000;157:1439–1445. - PMC - PubMed
    1. Hurtig HI, Trojanowski JQ, Galvin J, Ewbank D, Schmidt ML, Lee VM, Clark CM, Glosser G, Stern MB, Gollomp SM, Arnold SE. Alpha-synuclein cortical Lewy bodies correlate with dementia in Parkinson's disease. Neurology. 2000;54:1916–1921. - PubMed
    1. Giasson BI, Duda JE, Murray IV, Chen Q, Souza JM, Hurtig HI, Ischiropoulos H, Trojanowski JQ, Lee VM. Oxidative damage linked to neurodegeneration by selective alpha-synuclein nitration in synucleinopathy lesions. Science. 2000;290:985–989. - PubMed
    1. Krishnan S, Chi EY, Wood SJ, Kendrick BS, Li C, Garzon-Rodriguez W, Wypych J, Randolph TW, Narhi LO, Biere AL, Citron M, Carpenter JF. Oxidative dimer formation is the critical rate-limiting step for Parkinson's disease alpha-synuclein fibrillogenesis. Biochemistry. 2003;42:829–837. - PubMed
    1. Paxinou E, Chen Q, Weisse M, Giasson BI, Norris EH, Rueter SM, Trojanowski JQ, Lee VM, Ischiropoulos H. Induction of alpha-synuclein aggregation by intracellular nitrative insult. J Neurosci. 2001;21:8053–8061. - PMC - PubMed

Publication types

MeSH terms