. 2009 May;101(5):2434-46.
doi: 10.1152/jn.00047.2009. Epub 2009 Mar 11.

Distinct functional and anatomical architecture of the endocannabinoid system in the auditory brainstem

Affiliations

Distinct functional and anatomical architecture of the endocannabinoid system in the auditory brainstem

Yanjun Zhao et al. J Neurophysiol. 2009 May.

Erratum in

  • J Neurophysiol. 2010 May;103(5):2931

Abstract

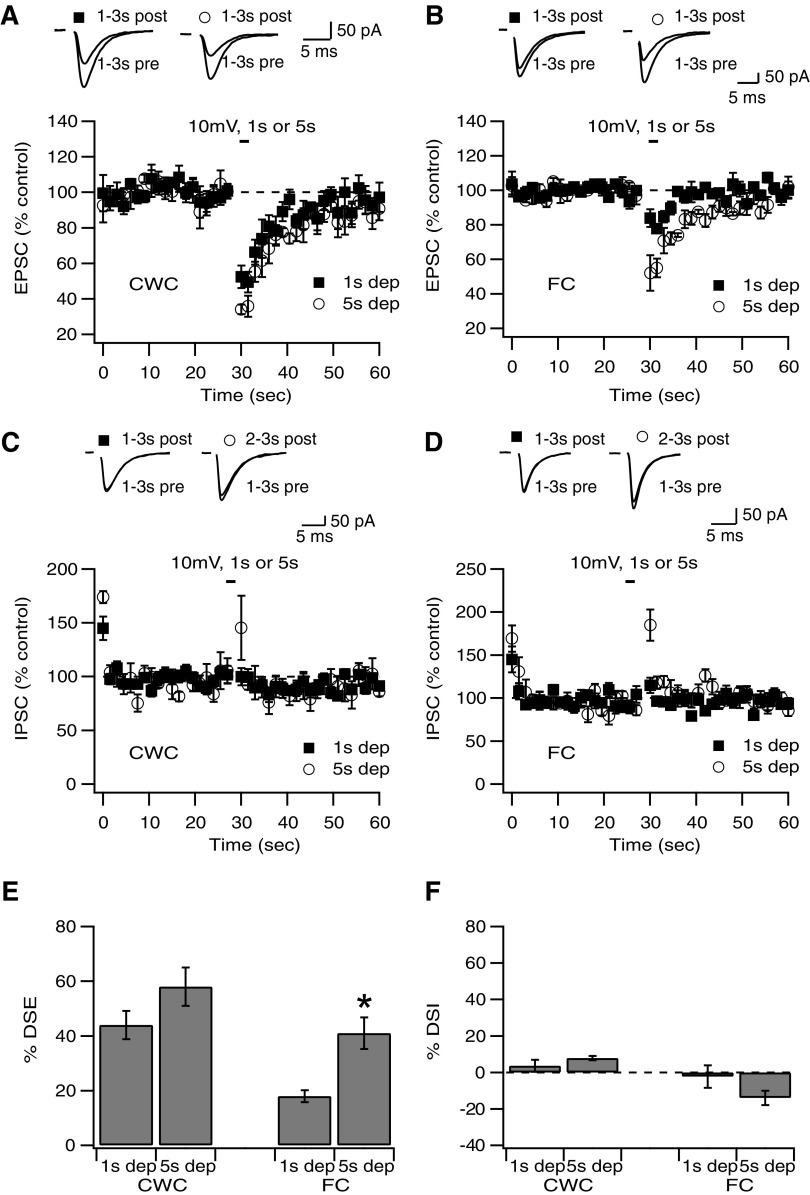
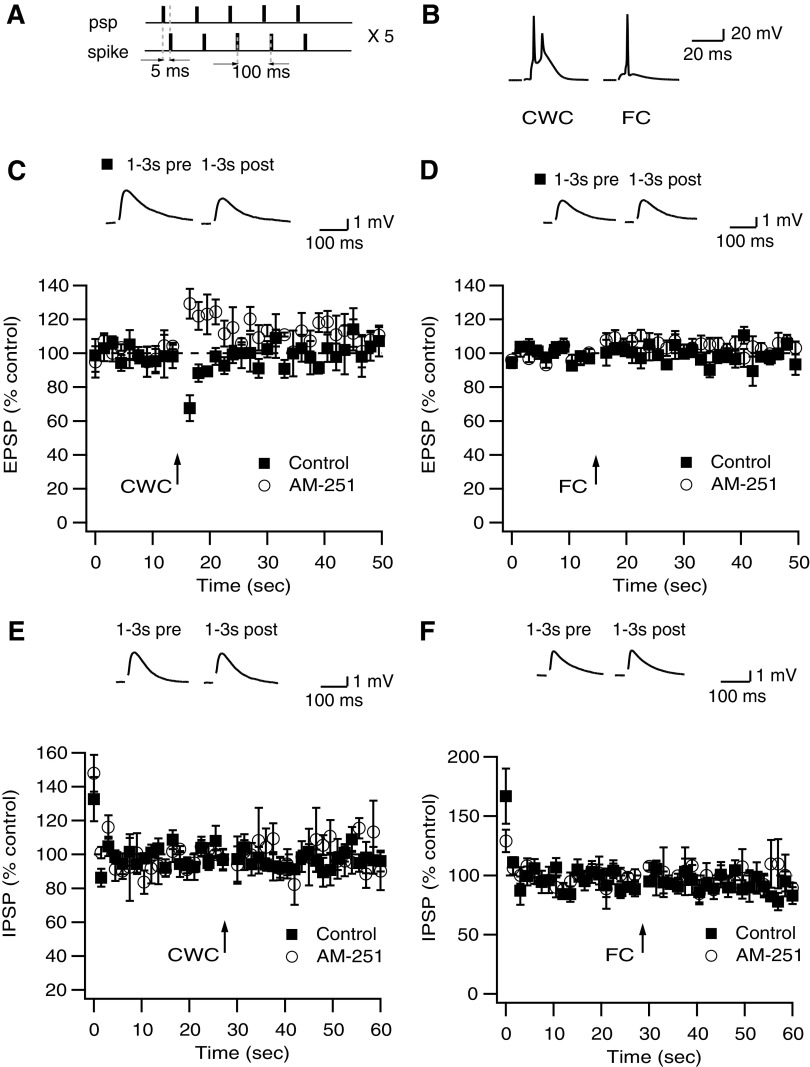
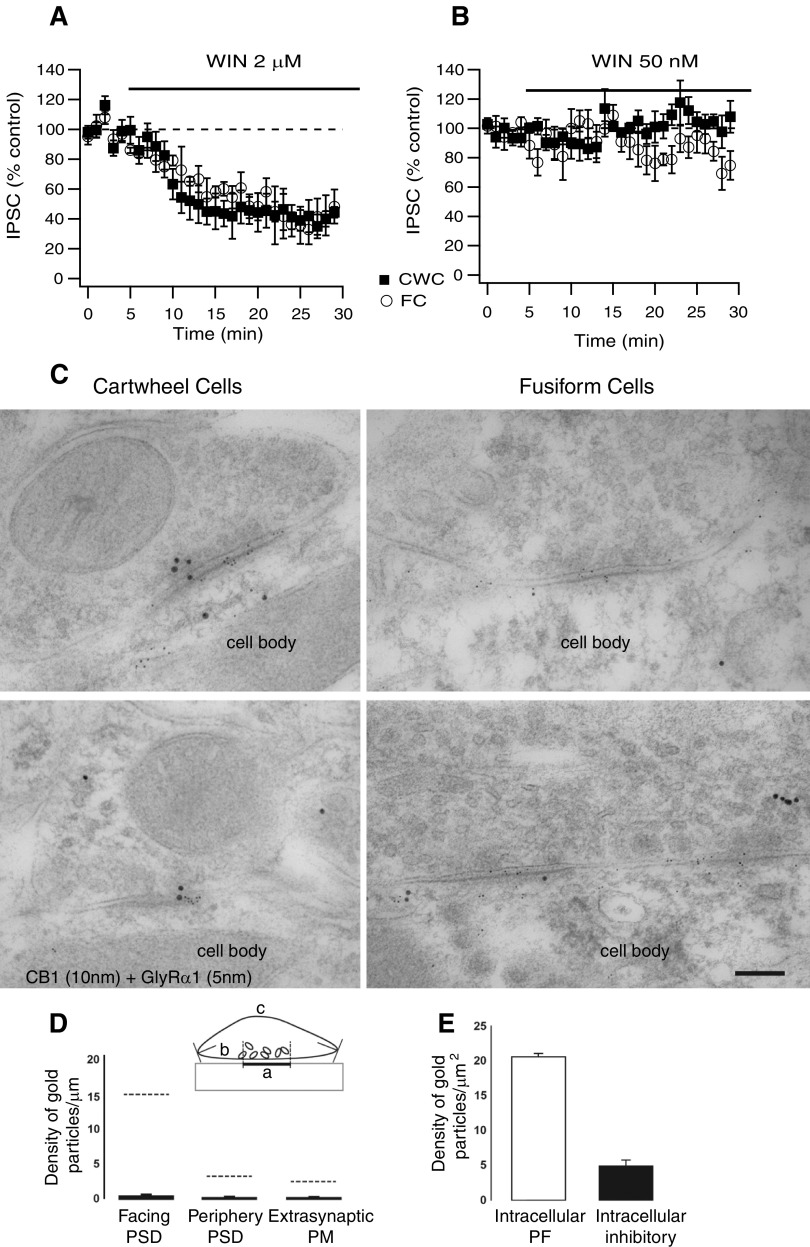
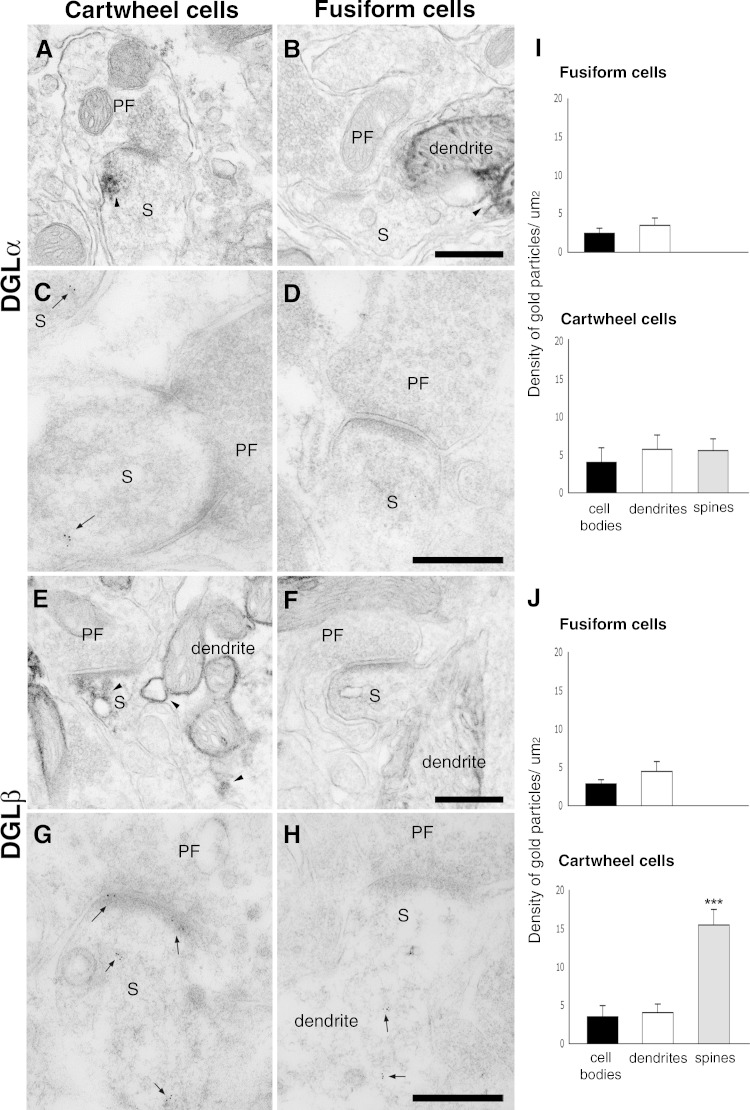
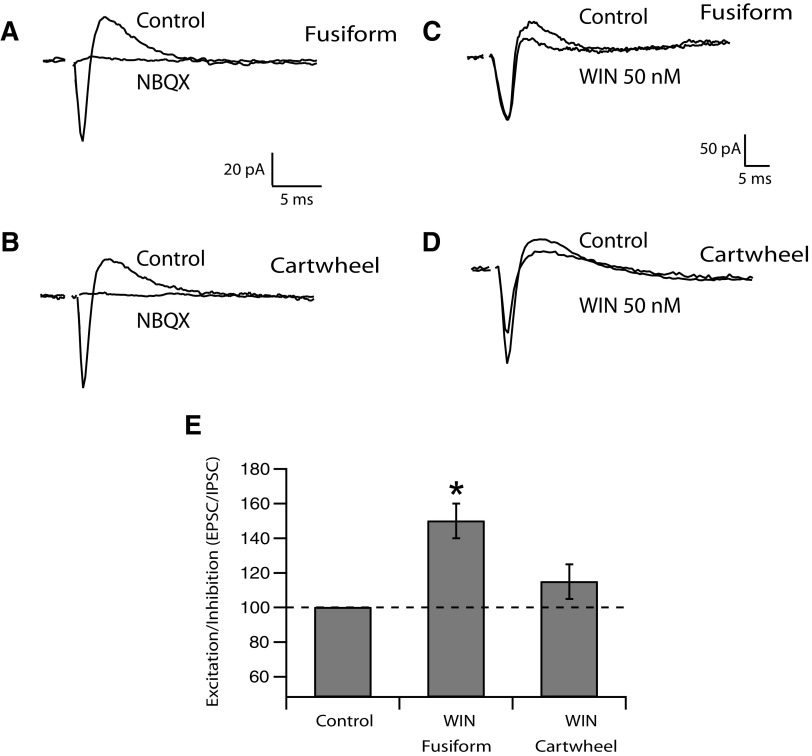
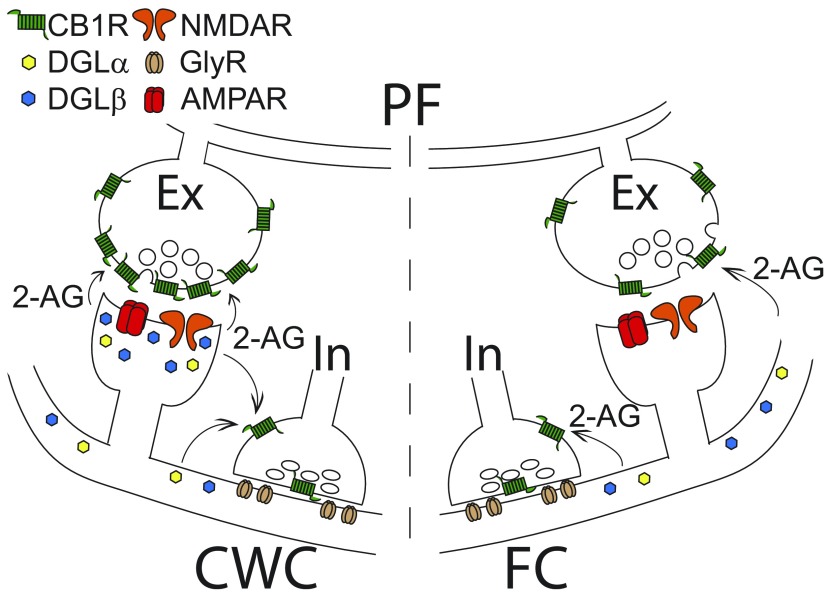
Endocannabinoids (ECs) act as retrograde messengers that enable postsynaptic cells to regulate the strength of their synaptic inputs. Here, by using physiological and histological techniques, we showed that, unlike in other parts of the brain, excitatory inputs are more sensitive than inhibitory inputs to EC signaling in the dorsal cochlear nucleus (DCN), an auditory brainstem nucleus. The principal cells of the DCN, fusiform cells, integrate acoustic signals through nonplastic synapses located in the deep layer with multimodal sensory signals carried by plastic parallel fibers in the molecular layer. Parallel fibers contact fusiform cells and inhibitory interneurons, the cartwheel cells, which in turn inhibit fusiform cells. Postsynaptic depolarization or pairing of postsynaptic potentials (PSPs) with action potentials (APs) induced EC-mediated modulation of excitatory inputs but did not affect inhibitory inputs. Quantitative electron microscopical studies showed that glutamatergic terminals express more cannabinoid 1 receptors (CB1Rs) than glycinergic terminals. Fusiform and cartwheel cells express diacylglycerol lipase alpha and beta (DGLalpha/beta), the two enzymes involved in the generation of the EC, 2-arachidonoyl-glycerol (2-AG). DGLalpha and DGLbeta are found in the spines of cartwheel but not fusiform cells indicating that the synthesis of ECs is more distant from parallel fiber synapses in fusiform than cartwheel cells. The differential localization and density of DGLalpha/beta and CB1Rs leads to cell- and input-specific EC signaling that favors activity-dependent EC-mediated suppression at synapses between parallel fibers and cartwheel cell spines, thus leading to reduced feedforward inhibition in fusiform cells. We propose that EC signaling is a major modulator of the balance of excitation and inhibition in auditory circuits.


Figures

FIG. 1.
FIG. 1.
Cell- and input-specific endocannabinoid (EC) signaling: differential depolarization-induced suppression of excitatory inputs (DSE) in cartwheel and fusiform cells and lack of depolarization-induced suppression of inhibitory inputs (DSI) in both cell types. A: time course of DSE, induced by 1- or 5-s depolarization in cartwheel cells (CWCs). Traces represent average excitatory postsynaptic current (EPSC) 1–3 s before and 1–3 s after depolarization. B: time course of DSE, induced by 1- or 5-s depolarization in fusiform cells (FCs). Traces represent average EPSC 1–3 s before and 1–3 s after depolarization. C: time course of DSI, induced by 1- or 5-s depolarization in CWCs. Traces represent average inhibitory postsynaptic current (IPSC) 1–3 s before and 1–3 s after 1-s depolarization or 2–3 s after 5-s depolarization. D: time course of DSI, induced by 1- or 5-s depolarization in FCs. Traces represent average IPSC 1–3 s before and 1–3 s after 1-s depolarization or 2–3 s after 5-s d depolarization. E: summary graph showing comparison of average DSE in CWCs and FCs. Average DSE was calculated as average EPSC 1–3 s after/before depolarization (CWCs: DSE after 1-s depolarization: 44 ± 5%, n = 5; DSE after 5-s depolarization: 58 ± 7%, n = 5; FCs: 1 s, 18 ± 2%, n = 6; 5 s, 41 ± 6%, n = 5, P < 0.05). F: summary graph showing comparison of average DSI in CWCs and FCs. Average DSI was calculated as average IPSC 1–3 s after/before depolarization (CWCs: DSI after 1-s depolarization: 4 ± 3%, n = 8; DSI after 5-s depolarization: 8 ± 1%, n = 5; FCs: 1 s, −2 ± 6%, n = 7; 5 s, −14 ± 4%, n = 5). All means are reported ±SE.
FIG. 2.
FIG. 2.
Pairing of postsynaptic potentials (PSPs) and spikes shows similar cell- and input-specific EC signaling in the dorsal cochlear nucleus (DCN). A: EC signaling was induced by a protocol comprising of 5 pairs of subthreshold excitatory PSPs (EPSPs) and current-evoked spikes delivered 5 ms later. These 5 pairs were delivered at 100-ms intervals, followed by a 5-s pause, and repeated a total of 5 times. B: example of a cell's (left, CWC; right, FC) responses to pairing of a subthreshold EPSP with a current-evoked spike delivered 5 ms later. C: time course of EC-mediated inhibition of parallel fiber inputs to CWCs induced by the pairing protocol (control: average EPSP 1–3 s after/before pairing: 81 ± 3%, n = 5, P < 0.05; AM-251: average EPSP 1–3 s after/before paring: 125 ± 8%, n = 5, P < 0.05). Traces represent average EPSP 1–3 s before and 1–3 s after pairing. D: time course of EC-mediated inhibition of parallel fiber inputs to FCs induced by the pairing protocol (control: average EPSP 1–3 s after/before pairing: 102 ± 4%, n = 6; AM-251: average EPSP 1–3 s after/before paring: 107 ± 4%, n = 5). Traces represent average EPSP 1–3 s before and 1–3 s after pairing. E: time course of EC-mediated inhibition of glycinergic inputs to CWCs induced by the pairing protocol, (control: average IPSP 1–3 s after/before pairing: 99 ± 3%, n = 5; AM-251: average IPSP 1–3 s after/before pairing: 98 ± 8%, n = 5). Traces represent average IPSP 1–3 s before and 1–3 s after pairing. F: time course of EC-mediated inhibition of glycinergic inputs to FCs induced by the pairing protocol (control: average IPSP 1–3 s after/before pairing: 98 ± 4%, n = 5; AM-251: average IPSP 1–3 s after/before paring: 103 ± 12%, n = 5). Traces represent average IPSP 1–3 s before and 1–3 s after pairing. All means are reported ±SE.
FIG. 3.
FIG. 3.
Low expression of cannabinoid 1 receptors (CB1Rs) in glycinergic inhibitory synaptic endings. A: time course of 2 μM WIN-55212-2 block of transmission in CWCs and FCs. Average WIN block was calculated as average IPSC 25–30 min after/before WIN application: CWCs: 40 ±2 %, n = 4; FCs: 40 ± 3%, n = 4. B: time course of 50 nM WIN-55212-2 block of transmission in CWCs and FCs. Average WIN block was calculated as average IPSC 25–30 min after/before WIN application: CWCs: 103 ± 2%, n = 5; FCs: 91 ±3 %, n = 4. C: electron micrographs show double postembedding immunogold labeling for CB1Rs (10 nm) and GlyRα1 (5 nm) on cartwheel cell axons on cartwheel and fusiform cells. Gold particles for GlyRα1 are only observed at the postsynaptic membranes and intracellularly in the cell bodies. Scale bar: 0.2 μm. D: histogram showing the distribution and the density of gold particles for CB1Rs at the plasma membrane of CWC endings. Dashed lines represent the density of membrane-associated gold particles for CB1Rs on parallel fiber endings synapsing onto CWCs as described by Tzounopoulos et al. 2007. E: histogram showing the density of gold particles for CB1Rs in the axoplasm of glutamatergic parallel fibers and the glycinergic ending of cartwheel cells on both FCs and CWCs.
FIG. 4.
FIG. 4.
2-arachidonoyl-glycerol (2-AG) mediates EC signaling in CWCs and FCs. A: Time course of DSE in tetrahydrolipstatin (THL; inhibitor of 2-AG synthesis) in CWCs. B: time course of DSE in RHC-80267 (RHC; inhibitor of 2-AG synthesis) in CWCs. C: time course of DSE in THL in fusiform cells. D: summary graph showing comparison of average DSE in control and diacylglycerol lipase (DGL) blockers, for CWCs and FCs. Average values were calculated as indicated in Fig. 1 (CWCs: control DSE: 67 ± 5.5%, n = 7; DSE in THL: 0.5 ± 3.5%, n = 6, P < 0.05; DSE in RHC: 33 ± 6%, n = 6, P < 0.05; FCs: control DSE: 29.5 ± 4%, n = 4; DSE in THL: 9 ± 2.5%, n = 7, P < 0.05). All means are reported ±SE.
FIG. 5.
FIG. 5.
Differential distribution of DGLα and DGLβ at parallel fiber synapses on FCs and CWCs. Electronmicrographs show pre-embedding immunohistochemistry (A and B and E and F) and postembedding immunogold labeling (C and D and G and H) for DGLα and DGLβ. A, B, E, and F: electrondense reaction for DGLα or DGLβ is observed in spines(s) of CWCs but not in spines of FCs. Dendrites of both cell types contain positive immunoreaction associated to intracellular organelles. The postsynaptic density (PSD) of CWCs receiving parallel fiber (PF) synapses also present electrondense reaction but only for DGLβ. Scale bar: 0.5 μm. C, D, G, and H: postembedding immunogold labeling for DGLα and DGLβ in spines(s) of CWCs and FCs. Only spines of CWCs present gold particles for both enzymes. G: electronmicrograph showing the localization of gold particles for DGLβ at the postsynaptic density of CWC spines receiving PF. Arrows point out the localization of the enzymes. Scale bar: 0.2 μm. I and J: histograms showing the density of gold particles for both enzymes, per area of cell bodies, dendrites, and spines. ***P < 0.005.
FIG. 6.
FIG. 6.
Cell- and input-specific EC signaling modulates the balance of excitation/inhibition in the auditory brainstem. A and B: EPSC-IPSC sequence evoked in FCs and CWCs by parallel fiber stimulation. AMPA-type receptor antagonist (NBQX, 10 μM) blocks both inward (EPSC) and outward (IPSC) current, confirming the disynaptic origin of the IPSC. C and D: effect of 50 nM WIN on EPSC-IPSC sequence in FCs and CWCs. WIN (50 nM) reduces disynaptic IPSC but does not reduce monosynaptic EPSC in FCs. WIN (50 nM) reduces disynaptic IPSC and monosynaptic EPSC in FCs. E: summary graph showing the changes in EPSC/IPSC ratio between control and 20–30 min after WIN application. Ratios were normalized to control values (FCs: 150 ± 10%, n = 7, P < 0.05; CWCs: 115 ± 10%, n = 5).
FIG. 7.
FIG. 7.
Schematic illustration showing the anatomical organization of EC signaling in the excitatory and inhibitory inputs of the DCN. Cartoon showing lower levels of expression of CB1Rs in glycinergic terminals compared with glutamatergic terminals. CB1Rs are more abundant in parallel fiber terminals innervating CWCs. Both CWC and FC release 2-AG and express DGLα and DGLβ. However, expression of DGLβ shows a preference for the spines of CWCs. The distance that 2-AG has to travel to activate CB1Rs is longer, on average, for the glycinergic terminals. Taken together, the architecture of the EC system in the DCN is different from the ones reported for the hippocampus, cerebellum, and striatum and is consistent with lack of DSI under protocols that induce DSE. Ex, excitatory, glutamatergic terminals; In, inhibitory, glycinergic terminals; PF, parallel fibers.

Similar articles

Cited by

References

    1. AdeKKAde KK, Lovinger DM. Anandamide regulates postnatal development of long-term synaptic plasticity in the rat dorsolateral striatum. J Neurosci 27: 2403–2409, 2007. - PMC - PubMed
    1. AzadSCAzad SC, Monory K, Marsicano G, Cravatt BF, Lutz B, Zieglgansberger W, Rammes G. Circuitry for associative plasticity in the amygdala involves endocannabinoid signaling. J Neurosci 24: 9953–9961, 2004. - PMC - PubMed
    1. BeierleinMBeierlein M, Fioravante D, Regehr WG. Differential expression of posttetanic potentiation and retrograde signaling mediate target-dependent short-term synaptic plasticity. Neuron 54: 949–959, 2007. - PMC - PubMed
    1. BeierleinMBeierlein M, Regehr WG. Local interneurons regulate synaptic strength by retrograde release of endocannabinoids. J Neurosci 26: 9935–9943, 2006. - PMC - PubMed
    1. BellCCBell CC. Evolution of cerebellum-like structures. Brain Beh Evol 59: 312–326, 2002. - PubMed

Publication types

MeSH terms

LinkOut - more resources