

Immune-induced epithelial to mesenchymal transition in vivo generates breast cancer stem cells
- PMID: 19276366
- PMCID: PMC2664865
- DOI: 10.1158/0008-5472.CAN-08-3343
Immune-induced epithelial to mesenchymal transition in vivo generates breast cancer stem cells
Abstract
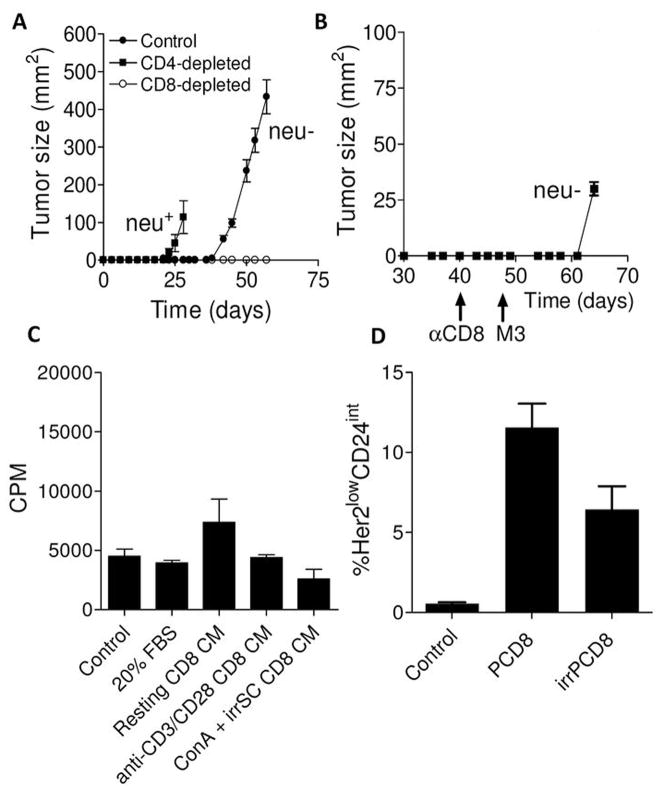
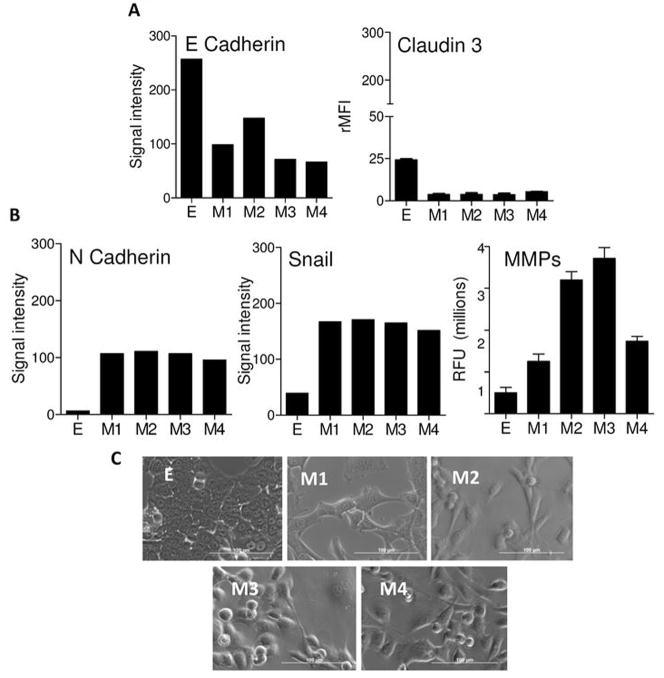
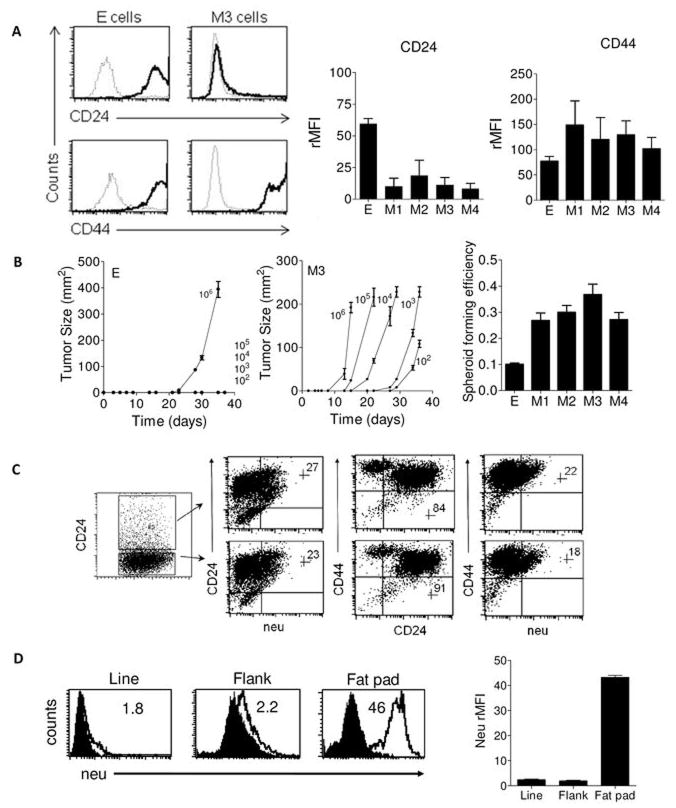
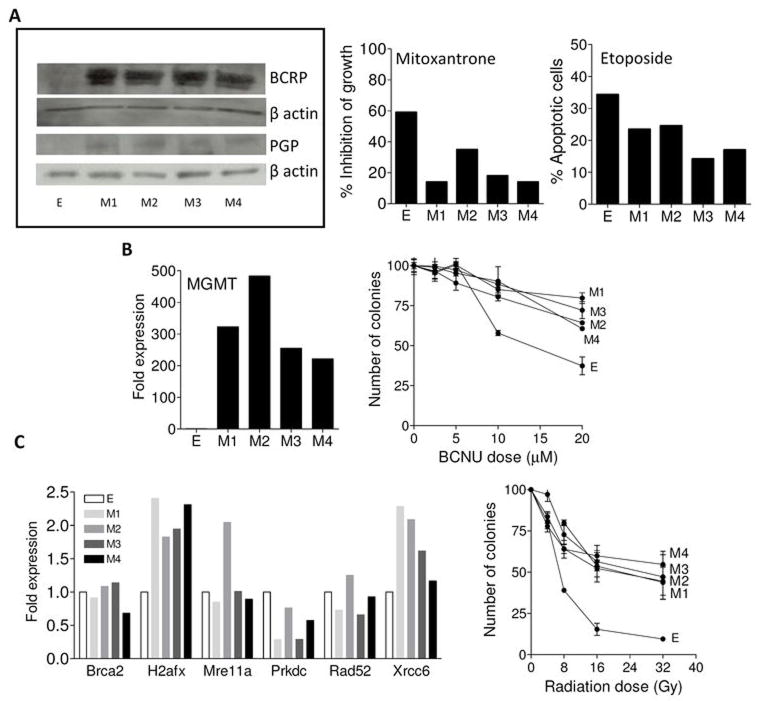
The breast cancer stem cell (BCSC) hypotheses suggest that breast cancer is derived from a single tumor-initiating cell with stem-like properties, but the source of these cells is unclear. We previously observed that induction of an immune response against an epithelial breast cancer led in vivo to the T-cell-dependent outgrowth of a tumor, the cells of which had undergone epithelial to mesenchymal transition (EMT). The resulting mesenchymal tumor cells had a CD24(-/lo)CD44(+) phenotype, consistent with BCSCs. In the present study, we found that EMT was induced by CD8 T cells and the resulting tumors had characteristics of BCSCs, including potent tumorigenicity, ability to reestablish an epithelial tumor, and enhanced resistance to drugs and radiation. In contrast to the hierarchal cancer stem cell hypothesis, which suggests that breast cancer arises from the transformation of a resident tissue stem cell, our results show that EMT can produce the BCSC phenotype. These findings have several important implications related to disease progression and relapse.
Figures
Similar articles
-
Epithelial mesenchymal transition traits in human breast cancer cell lines parallel the CD44(hi/)CD24 (lo/-) stem cell phenotype in human breast cancer.J Mammary Gland Biol Neoplasia. 2010 Jun;15(2):235-52. doi: 10.1007/s10911-010-9175-z. Epub 2010 Jun 4. J Mammary Gland Biol Neoplasia. 2010. PMID: 20521089 Review.
-
Breast cancer stem cells transition between epithelial and mesenchymal states reflective of their normal counterparts.Stem Cell Reports. 2013 Dec 27;2(1):78-91. doi: 10.1016/j.stemcr.2013.11.009. eCollection 2014 Jan 14. Stem Cell Reports. 2013. PMID: 24511467 Free PMC article.
-
Evidence for circulating cancer stem-like cells and epithelial-mesenchymal transition phenotype in the pleurospheres derived from lung adenocarcinoma using liquid biopsy.Tumour Biol. 2017 Mar;39(3):1010428317695915. doi: 10.1177/1010428317695915. Tumour Biol. 2017. PMID: 28347243
-
IL-6-induced epithelial-mesenchymal transition promotes the generation of breast cancer stem-like cells analogous to mammosphere cultures.Int J Oncol. 2012 Apr;40(4):1171-9. doi: 10.3892/ijo.2011.1275. Epub 2011 Nov 30. Int J Oncol. 2012. PMID: 22134360 Free PMC article.
-
The epithelial-to-mesenchymal transition and cancer stem cells: a coalition against cancer therapies.J Mammary Gland Biol Neoplasia. 2009 Mar;14(1):29-43. doi: 10.1007/s10911-009-9110-3. Epub 2009 Feb 26. J Mammary Gland Biol Neoplasia. 2009. PMID: 19242781 Review.
Cited by
-
The impact of low-dose carcinogens and environmental disruptors on tissue invasion and metastasis.Carcinogenesis. 2015 Jun;36 Suppl 1(Suppl 1):S128-59. doi: 10.1093/carcin/bgv034. Carcinogenesis. 2015. PMID: 26106135 Free PMC article. Review.
-
Separation and Characterization of Epithelial and Mesenchymal-like Murine Mammary Tumor Cells Reveals Epithelial Cell Differentiation Plasticity and Enhanced Tumorigenicity of Epithelial-enriched Tumor Cells.Cancer Microenviron. 2013 Apr;6(1):79-89. doi: 10.1007/s12307-011-0095-2. Epub 2012 Jan 12. Cancer Microenviron. 2013. PMID: 22237886 Free PMC article.
-
Plasticity of tumour and immune cells: a source of heterogeneity and a cause for therapy resistance?Nat Rev Cancer. 2013 May;13(5):365-76. doi: 10.1038/nrc3498. Epub 2013 Mar 28. Nat Rev Cancer. 2013. PMID: 23535846 Review.
-
Resistance to Trastuzumab.Cancers (Basel). 2022 Oct 19;14(20):5115. doi: 10.3390/cancers14205115. Cancers (Basel). 2022. PMID: 36291900 Free PMC article. Review.
-
Immune promotion of epithelial-mesenchymal transition and generation of breast cancer stem cells.Cancer Res. 2010 Apr 15;70(8):3005-8. doi: 10.1158/0008-5472.CAN-09-4041. Cancer Res. 2010. PMID: 20395197 Free PMC article. Review.
References
-
- Group EBCTC. Effects of chemotherapy and hormonal therapy for early breast cancer on recurrence and 15-year survival: an overview of the randomised trials. Lancet. 2005;365:1687–717. - PubMed
-
- Pierce GB, Nakane PK, Martinez-Hernandez A, Ward JM. Ultrastructural comparison of differentiation of stem cells of murine adenocarcinomas of colon and breast with their normal counterparts. J Natl Cancer Inst. 1977;58:1329–45. - PubMed
-
- Cho RW, Wang X, Diehn M, et al. Isolation and molecular characterization of cancer stem cells in MMTV-Wnt-1 murine breast tumors. Stem Cells. 2008;26:364–71. - PubMed
Publication types
MeSH terms
Substances
Grants and funding
LinkOut - more resources
Full Text Sources
Other Literature Sources
Molecular Biology Databases
Research Materials
Miscellaneous
