. 2009 Mar 16;206(3):607-22.
doi: 10.1084/jem.20082232. Epub 2009 Mar 9.

Thymus-homing peripheral dendritic cells constitute two of the three major subsets of dendritic cells in the steady-state thymus

Affiliations

Thymus-homing peripheral dendritic cells constitute two of the three major subsets of dendritic cells in the steady-state thymus

JiChu Li et al. J Exp Med. .

Abstract

Many dendritic cells (DCs) in the normal mouse thymus are generated intrathymically from common T cell/DC progenitors. However, our previous work suggested that at least 50% of thymic DCs originate independently of these progenitors. We now formally demonstrate by parabiotic, adoptive transfer, and developmental studies that two of the three major subsets of thymic DCs originate extrathymically and continually migrate to the thymus, where they occupy a finite number of microenvironmental niches. The thymus-homing DCs consisted of immature plasmacytoid DCs (pDCs) and the signal regulatory protein alpha-positive (Sirpalpha(+)) CD11b(+) CD8alpha(-) subset of conventional DCs (cDCs), both of which could take up and transport circulating antigen to the thymus. The cDCs of intrathymic origin were mostly Sirpalpha(-) CD11b(-) CD8alpha(hi) cells. Upon arrival in the thymus, the migrant pDCs enlarged and up-regulated CD11c, major histocompatibility complex II (MHC II), and CD8alpha, but maintained their plasmacytoid morphology. In contrast, the migrant cDCs proliferated extensively, up-regulated CD11c, MHC II, and CD86, and expressed dendritic processes. The possible functional implications of these findings are discussed.


Figures
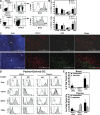
Figure 1.
Figure 1.
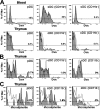
Partner-derived DCs in the blood and thymus of parabiotic mice. CD45.1 and CD45.2 congenic mice or eGFP tg and WT mice were joined by cutaneous vascular anastomosis. (A–D) The blood and thymus of each partner were harvested at week 3. (E) The parabiotic mice were separated at week 3 and rested for 4 wk before harvest of the blood and thymus. Five-color FACS analysis for CD45.1, CD45.2, or GFP plus CD11c, B220, Sirpα, and one of the other surface antigens listed in D was performed on each sample. Background fluorescence (unshaded profiles) was determined by omitting only the relevant antibody. (A) Partner-derived DCs (CD45.2+ CD11c+ in this example) were identified in the blood and thymus (arrows), and the percentages of cDCs and pDCs (shaded profiles) were determined by analysis for B220 and B220+ cells, respectively. Note that numerous CD11c donor-origin cells (mostly CD3+ T cells) were present in the blood but not the thymus. A representative analysis is shown (1 out of 16 parabiotic partners from two experiments). (B) Percentage of each indicated cell population in the blood and thymus that was partner derived. Data are means ± SD of four parabiotic pairs from one out of two experiments. *, P < 0.05 between paired values for the blood and thymus. (C) Location of partner-derived DCs (GFP+ CD11c+) in the thymus by immunohistology. (top) Isotype controls for CD11c examined by three-color fluorescence microscopy of the same field for DAPI (blue), GFP (green), and CD11c (red). (bottom) A comparable field stained for CD11c. The cortical (C) and medullary (M) regions are indicated in the DAPI-stained panels, the donor-origin cells are indicated by GFP fluorescence, and the total DCs are indicated by the CD11c staining. Representative sections from one out of three GFP parabiotic partners are shown. Bars, 200 µm. (D) Surface phenotypes of partner-derived cDCs and pDCs in the blood and thymus were determined by FACS analysis for Sirpα, CD11b, MHC II, and/or CD8α (shaded profiles) as compared with background fluorescence (unshaded profiles). Representative analyses of parabiotic partners from one out of two experiments are shown. (E) Effects of interrupting the cross-exchange of blood on the levels of DC chimerism in the blood and thymus of parabiotic mice. Pairs of mice were sacrificed 3 wk after parabiosis (unseparated), or were surgically separated and rested for 4 wk before being sacrificed (separated). The relative percentage of total pDCs, Sirpα+ CD11b+ cDCs, and Sirpα CD11b cDCs of partner origin were determined by FACS analysis. Data are means ± SD of four pairs of parabiotic mice from one out of two experiments. Each bar represents the pooled results from four parabiotic partners. *, P < 0.01 between unseparated and separated mice.
Figure 2.
Figure 2.
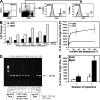
Migration of DCs to the thymus of normal adoptive recipients. (A) 20 million nucleated blood cells from adult eGFP tg mice were injected i.v. into 5–7-wk-old nonirradiated WT recipients. Thymus cells were harvested 2 d later, total cDCs and pDCs were identified (arrows), and the percentage that were of donor origin (GFP+) was determined. Thymic cDCs and pDCs from GFP−/− control mice were used to determine background fluorescence. More than 90% of the B220+ donor-origin cells were PDCA+ Gr-1+ NK1.1, and >90% of the B220 donor-origin cells were PDCA Gr-1 NK1.1 (Fig. 3). Density gradient–enriched (40–50%) DCs from adoptive recipients showed comparable results. A representative analysis from >60 mice in eight experiments is shown. (B) Time–response. WT mice were injected i.v. with 20 × 106 bone marrow cells from eGFP tg mice, the thymocytes were harvested at the indicated times thereafter, and the percentage of the total cDCs and pDCs that were of donor origin (GFP+) were determined. A representative analysis from one out of three experiments is shown. (C) Dose–response. The total numbers of donor-origin (GFP+) pDCs and cDCs in the recipient thymus were determined 2 d after i.v. injection of graded numbers of bone marrow cells from eGFP tg mice, as indicated. Each point represents the mean ± SD of five recipients from one out of two experiments. (D) The sensitivity of the PCR assay was determined by serial dilution of thymic DNA from eGFP tg mice (lanes 10 to 12), and the numbers of cell equivalents were determined by dividing the pg of DNA by 6.24. Further resolution between 62.4 and 6.24 pg DNA revealed a sensitivity of two cell equivalents (not depicted). The sensitivity of the PCR assay was also determined by analyzing purposeful mixtures of GFP+ thymic DCs and GFP thymocytes (lanes 3–9) or a mixture of 62.4 pg GFP+ DNA with 1.7 × 10⁶ pg GFP DNA (lanes 2 and 3). Lane 1 represents a 100-bp DNA ladder. A representative analysis from one out of eight experiments is shown. (E) Multiple injections. Groups of five normal WT mice were injected i.v. with either a single dose (20 × 106) of bone marrow cells from eGFP tg mice or five consecutive doses on alternate days. Thymocytes were harvested 2 d after the single dose or the last of the multiple doses, and the mean (±SD) total numbers of GFP+ cDCs and pDCs per thymus were determined. *, P < 0.01 between the respective data for one and five injections. A representative analysis from one out of two experiments is shown.
Figure 3.
Figure 3.
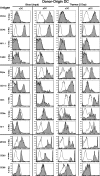
Surface phenotypes of donor-origin DCs in the blood and thymus of adoptive recipients. 20 million blood cells from eGFP+ tg mice (input) were injected i.v. into normal WT recipients. After 2 d, blood and thymus cells were harvested and stained for CD11c, B220, Sirpα, and one of the other listed surface antigens. The markers were divided into three groups: (top) PDCA, CD45, NK1.1, and F4/80 to confirm that the CD11c+ cells were cDCs and pDCs; (middle) Sirpα, CD11b, CD4, CD8α, and Gr-1 for DC subset identification; and (bottom) MHC II, CD80, and CD86 expression levels for maturity and activation. Background fluorescence with only the relevant antibody omitted is shown by the unshaded profile. Representative analyses from two to eight experiments are shown.
Figure 4.
Figure 4.
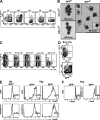
Activation, maturation, and proliferation of the DCs that enter the thymus. (A) Distribution of DCs in the blood, thymus, spleen, lymph nodes, and bone marrow from normal eGFP tg mice according to relative fluorescence intensity (high/low) for GFP and CD11c. The numbers indicate the percentage of total DCs present in each quadrant of the fluorescence profile. Only the CD11c+ GFP+ cells are shown. Representative profiles from five mice are shown. (B) Giemsa-stained cytocentrifuged suspensions of thymic DCs from normal eGFP tg mice sorted by FACS according to relative fluorescence intensity (high/low) for GFP and CD11c. Insets in the panel of GFPhi CD11chi DCs show mitotic figures (left) and a well-differentiated DC with prominent dendritic processes (right). A representative experiment (one out of three) is shown. (C) Distribution of the donor-origin DCs present in the thymus 2 d after i.v. injection of 20 × 106 eGFP tg blood, spleen, lymph node, bone marrow, or thymus cells into normal WT recipients according to relative fluorescence intensity (high/low) for GFP and CD11c. Only the CD11c+ GFP+ cells are shown. Representative profiles from one out of three experiments are shown. (D) Distribution of the donor-origin DCs present in the thymus 2 and 10 d after i.v. injection of 20 × 106 eGFP+ blood cells according to relative fluorescence intensity (high/low) for GFP and CD11c (note similarities between the profiles of donor-origin DCs at day 10 with that of total DCs in the normal thymus, as shown in A). Representative profiles from one out of two experiments (five mice each) are shown. (E) Cell-cycle analysis with 7-AAD of the GFPlo (immature) and/or GFPhi (mature) subsets of pDCs and CD11b+ cDCs in the blood and thymus of normal eGFP tg mice. The percentages of cells in S/G2/M are indicated. Representative profiles from one out of two experiments (three mice each) are shown. (F) Cell-cycle analysis of the donor-origin DCs present in the thymus 2 d after adoptive transfer of 20 × 106 eGFP tg blood cells into normal WT recipients. 7-AAD staining of donor-origin pDCs and CD11b+ cDCs. The percentages of cells in S/G2/M are indicated. Representative profiles from one out of two experiments (three mice each) are shown.
Figure 5.
Figure 5.
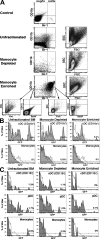
Monocytes do not migrate to the steady-state thymus. (A) Enrichment of monocytes from the blood. Unfractionated blood cells were sorted into monocyte-enriched (90–95% purity) and monocyte-depleted populations by immunomagnetic separation for MHC II, B220, CD43, and CD24 (see Materials and methods). Approximately 90% of the monocytes were Gr-1int/hi and 10% were Gr-1neg/lo. Each fraction was further characterized by light scatter analysis and CD11c expression. A representative experiment (one out of four) is shown. (B) Monocytes do not migrate to the thymus. 20 million unfractionated eGFP tg blood cells, 2 × 10⁶ monocyte-enriched blood cells, or 18 × 106 monocyte-depleted blood cells were injected i.v. into normal WT recipients. The proportions of the total CD11b+ thymic cells at 2 d that were donor-origin cDCs (CD11c+Gr-1F4/80) and/or monocytes (CD11cGr-1−or+F4/80+) were determined for each inoculum (percentages are indicated). A representative experiment (one out of three) is shown. (C) Monocytes do not generate DCs when injected directly into the thymus. Two million unfractionated, 0.2 × 10⁶ monocyte-enriched, or 1.8 × 10⁶ monocyte-depleted eGFP tg blood cells were injected into the thymus of normal WT recipients. After 10 d, the proportions of the total pDCs, CD11b+ cDCs, or monocytes that were of donor origin were determined (percentages are indicated). A representative experiment (one out of two) is shown.
Figure 6.
Figure 6.
DCs transport circulating OVA and microspheres to the thymus. (A) In vivo uptake of circulating soluble OVA by DCs in the blood and thymus. Normal WT mice were injected i.v. with 0.5 mg Alexa Fluor 488–OVA, and the percentages of total pDCs, CD11b+ cDCs, and CD11b cDCs in the blood and thymus that were OVA+ were determined by FACS analysis 18 h later. A representative experiment (one out of three) is shown. (B) Migration of OVA+ DCs to the thymus of adoptive recipients. 20 million nucleated blood cells from WT CD45.2 mice that had been injected i.v. with 0.5 mg OVA 18 h previously (as in A) were washed and transferred i.v. into normal WT CD45.1 recipients. After 24 h, the percentages of the total pDCs, CD11b+ cDCs, and CD11b cDCs in the thymus that were OVA+ were determined. All of the OVA+ DCs were of donor origin. Representative profiles from one out of two experiments are shown. (C) Experiments were performed as in A, except that 2-µm Fluoresbrite microspheres were substituted for soluble OVA. A representative experiment (one out of two) is shown.
Figure 7.
Figure 7.
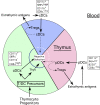
Functional implications of the blood-to-thymus migration pathway for DCs in the steady state. In this scheme, ∼50% of the total DCs in the steady-state thymus represent and/or arise from thymus-homing immature DCs or their immediate MHC II precursors in the blood. Virtually all of the pDCs and approximately one third of the cDCs in the thymus originate in this manner. The thymus-homing cDCs can be distinguished from the major population of intrathymic cDCs by the expression of Sirpα and CD11b, and the lack of expression of CD8α. Immature thymus-homing pDCs and cDCs acquire and process self- and nonself-antigens in the periphery under noninflammatory conditions and transport them to the thymus. Once in the thymus, (a) the pDCs and Sirpα+ CD11b+ cDCs occupy recently vacated niches in the medullary and corticomedullary regions, (b) the pDCs develop a semimature phenotype, and (c) the cDCs undergo activation, proliferation, and maturation into fully differentiated DCs. We propose as a working hypothesis that one or both of these thymus-homing DC populations assist, directly or indirectly, in the induction of antigen-specific CD4+ CD25+ Foxp3+ T reg cells and/or in antigen-specific negative selection. As a consequence, the diversity of the TCR repertoire of T reg and effector T cells in the thymus is continually altered to reflect the changing antigenic milieu in the periphery, especially to myriad foreign and some tissue-specific antigens that are not ectopically expressed by the thymic epithelium.

Similar articles

Cited by

References

    1. Wu L., Shortman K. 2005. Heterogeneity of thymic dendritic cells.Semin. Immunol. 17:304–312 - PubMed
    1. Donskoy E., Goldschneider I. 2003. Two developmentally distinct populations of dendritic cells inhabit the adult mouse thymus: demonstration by differential importation of hematogenous precursors under steady state conditions.J. Immunol. 170:3514–3521 - PubMed
    1. Porritt H.E., Gordon K., Petrie H.T. 2003. Kinetics of steady-state differentiation and mapping of intrathymic-signaling environments by stem cell transplantation in nonirradiated mice.J. Exp. Med. 198:957–962 - PMC - PubMed
    1. Wang Y., Goldschneider I., Foss D., Wu D.Y., O'Rourke J., Cone R.E. 1997. Direct thymic involvement in anterior chamber-associated immune deviation: evidence for a nondeletional mechanism of centrally induced tolerance to extrathymic antigens in adult mice.J. Immunol. 158:2150–2155 - PubMed
    1. Wang Y., Goldschneider I., O'Rourke J., Cone R.E. 2001. Blood mononuclear cells induce regulatory NK T thymocytes in anterior chamber-associated immune deviation.J. Leukoc. Biol. 69:741–746 - PubMed

Publication types

MeSH terms