. 2009 Mar 16;206(3):535-48.
doi: 10.1084/jem.20082293. Epub 2009 Mar 9.

Prostaglandin E2 regulates Th17 cell differentiation and function through cyclic AMP and EP2/EP4 receptor signaling

Affiliations

Prostaglandin E2 regulates Th17 cell differentiation and function through cyclic AMP and EP2/EP4 receptor signaling

Katia Boniface et al. J Exp Med. .

Abstract

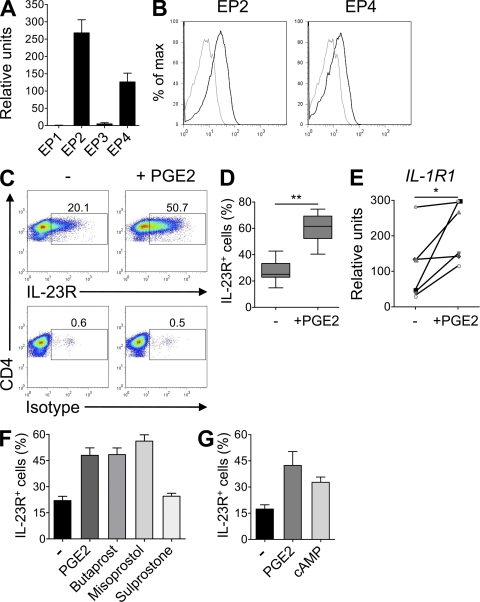
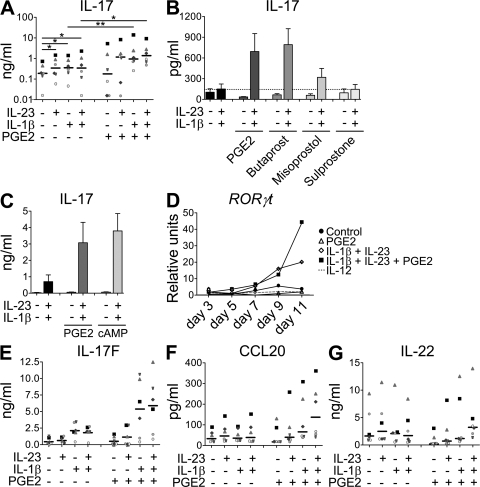
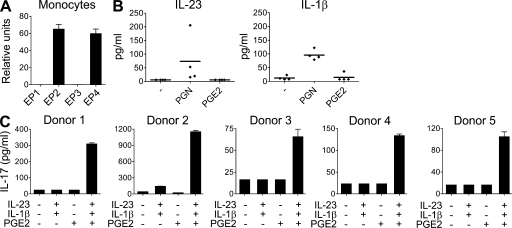
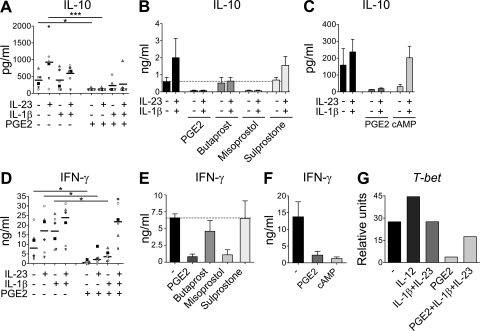
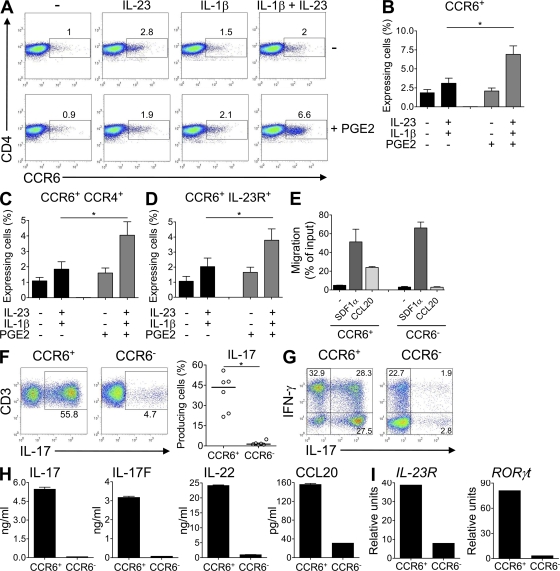
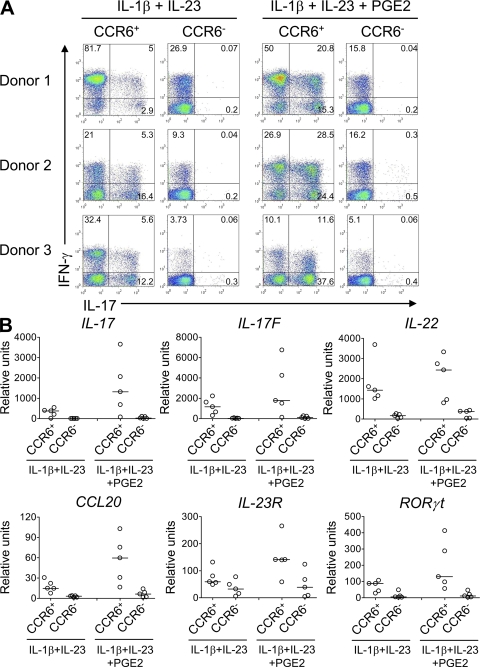
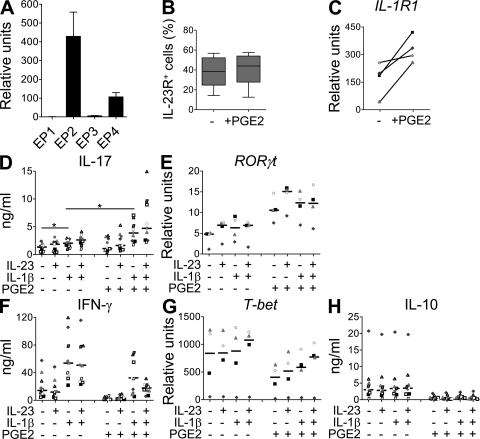
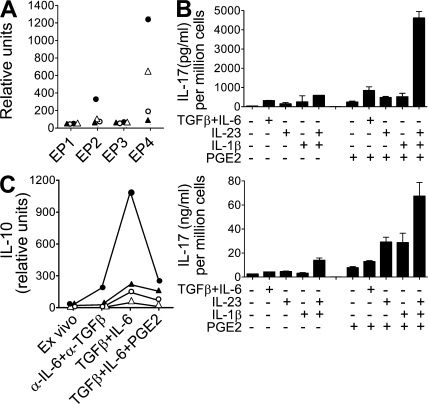
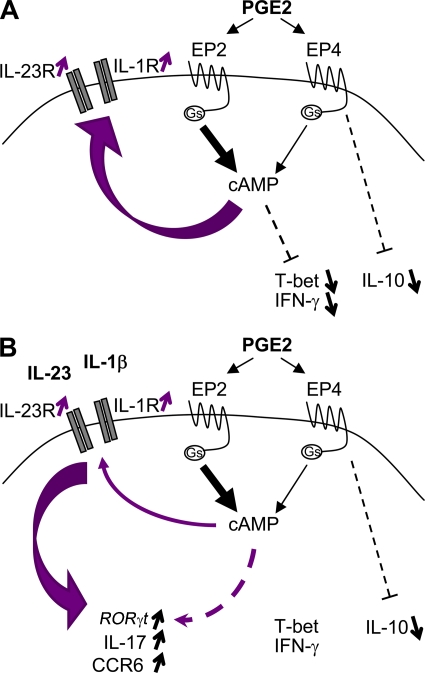
Prostaglandins, particularly prostaglandin E2 (PGE2), play an important role during inflammation. This is exemplified by the clinical use of cyclooxygenase 2 inhibitors, which interfere with PGE2 synthesis, as effective antiinflammatory drugs. Here, we show that PGE2 directly promotes differentiation and proinflammatory functions of human and murine IL-17-producing T helper (Th17) cells. In human purified naive T cells, PGE2 acts via prostaglandin receptor EP2- and EP4-mediated signaling and cyclic AMP pathways to up-regulate IL-23 and IL-1 receptor expression. Furthermore, PGE2 synergizes with IL-1beta and IL-23 to drive retinoic acid receptor-related orphan receptor (ROR)-gammat, IL-17, IL-17F, CCL20, and CCR6 expression, which is consistent with the reported Th17 phenotype. While enhancing Th17 cytokine expression mainly through EP2, PGE2 differentially regulates interferon (IFN)-gamma production and inhibits production of the antiinflammatory cytokine IL-10 in Th17 cells predominantly through EP4. Furthermore, PGE2 is required for IL-17 production in the presence of antigen-presenting cells. Hence, the combination of inflammatory cytokines and noncytokine immunomodulators, such as PGE2, during differentiation and activation determines the ultimate phenotype of Th17 cells. These findings, together with the altered IL-12/IL-23 balance induced by PGE2 in dendritic cells, further highlight the crucial role of the inflammatory microenvironment in Th17 cell development and regulation.


Figures

Figure 1.
Figure 1.
PGE2 up-regulates IL-23R and IL-1R1 expression on cultured human naive CD4+ T cells. (A) Real-time PCR analysis of EP1, EP2, EP3, and EP4 gene expression in human naive CD4+ T cells. Mean + SEM of eight donors. Relative amplification efficiencies of EP primer sets fell within standard Taqman assay specifications. (B) Isotype (gray) or EP2 and EP4 (black) surface staining. (C–G) Naive CD4+ T cells were activated with anti-CD3/CD28/CD2 beads and cultured for 11 d in the presence or absence of PGE2, dibutyryl-cAMP, or specific EP receptor agonists. (C–D) Flow cytometric quantification of IL-23R in CD3+ CD4+ T cells restimulated for 48 h. (D) Box and whiskers of eight independent experiments are shown. **, P < 0.01. (E) Real-time PCR analysis of IL-1R1 gene expression in T cells restimulated for 24 h. Results from six different donors are shown. *, P < 0.05. (F and G) Flow cytometric quantification of IL-23R in CD3+ CD4+ T cells restimulated for 48 h. Mean + SEM of four independent experiments.
Figure 2.
Figure 2.
PGE2, together with IL-1β and IL-23, enhances Th17 cell development predominantly via EP2 signaling and cAMP pathways. Human naive CD4+ T cells were activated with anti-CD3/CD28/CD2 beads and cultured for 11 d in the presence of IL-23, IL-1β, PGE2, dibutyryl-cAMP, and/or EP receptors agonists. (A–C) IL-17 production in cell-free supernatants of T cells restimulated for 48 h. (D) Real-time PCR of RORγt gene expression in T cells after indicated time of culture. (E–G) IL-17F (E), CCL20 (F), and IL-22 (G) production in cell-free supernatants of T cells restimulated for 48 h. Data from six different donors are shown in A, E, F, and G; horizontal bars represent median values. Results in B show mean + SEM of three independent experiments. Data in C show mean + SEM of five independent experiments. Data in D are representative of two independent experiments. *, P < 0.05; **, P < 0.01.
Figure 3.
Figure 3.
PGE2 is required for IL-23–IL-1β–induced IL-17 production in a monocyte-naive T cell co-culture system. (A) Real-time PCR analysis of EP1, EP2, EP3, and EP4 gene expression in human CD14+ monocytes. Mean + SEM of four donors. (B) Human CD14+ monocytes were stimulated in the presence of peptidoglycan or PGE2 for 24 h. IL-1β and IL-23 production was assessed in cell-free supernatants. Results from four independent donors are shown. (C) Human naive CD4+ T cells were co-cultured with monocytes (1:1), activated with anti-CD3 antibody, and cultured for 11 d in the presence of IL-23, IL-1β, and/or PGE2. IL-17 production in cell-free supernatants of T cells restimulated for 48 h was measured by ELISA. Results from five independent donors are shown.
Figure 4.
Figure 4.
PGE2 inhibits IL-10 and IFN-γ production predominantly via EP4 signaling and cAMP pathways. Human naive CD4+ T cells were activated with anti-CD3/CD28/CD2 beads and cultured for 11 d in the presence of IL-23, IL-1β, PGE2, dibutyryl-cAMP, and/or EP receptor agonists. (A–C) IL-10 production in cell-free supernatants of T cells restimulated for 48 h. (D–F) IFN-γ production in cell-free supernatants of T cells restimulated for 48 h. (G) Real-time PCR of T-bet mRNA expression in T cells after 11 d of culture. Data from six different donors are shown in A and D; horizontal bars represent median values. Results in B and E show mean + SEM of three independent experiments. Data in C and F show mean + SEM of five independent experiments. Data in G are representative of two independent experiments. *, P < 0.05; ***, P < 0.001.
Figure 5.
Figure 5.
CCR6 expression defines Th17 cytokine producers and is up-regulated in the presence of IL-1β, IL-23, and PGE2. Human naive CD4+ T cells were activated with anti-CD3/CD28/CD2 beads and cultured for 11 d in the presence of IL-23, IL-1β, and/or PGE2. (A) Flow cytometric quantification of CCR6 in CD3+ CD4+ T cells restimulated for 48 h. Results are representative of three independent experiments. (B–D) Flow cytometric quantification of CCR6+ (B), CCR6+CCR4+ (C), or CCR6+IL-23R+ (D) in CD3+ CD4+ T cells restimulated for 48 h. *, P < 0.05. Results represent mean + SEM of nine independent experiments. (E) CD4+CCR6+ and CD4+CCR6 T cells from IL-1β, IL-23, and PGE2-treated T cells were sorted and added to inserts that were placed in wells containing CCL20 or SDF-1α, forming an upper and lower chamber separated by a membrane bearing 5-µm pores. Responding cells that migrated to the lower chamber were harvested and counted by flow cytometry. Results represent mean + SEM of two independent donors and are expressed as the percentage of migration compared with the 100% migration control. (F–I) Naive T cells were activated with anti-CD3/CD28/CD2 beads and cultured for 11 d in the presence of IL-1β, IL-23, and/or PGE2. After reactivation, CD4+CCR6+ and CD4+CCR6 T cells were sorted and cultured for 7 d in the presence of IL-2. (F and G) Intracellular IL-17 and IFN-γ staining after stimulation with PMA/ionomycin. Results from six independent donors are shown in F. *, P < 0.05. Data in G are representative of six independent experiments. (H) Production of IL-17, IL-17F, IL-22, and CCL20 in cell-free supernatants of T cells restimulated for 24 h. (I) Real-time PCR analysis of IL-23R and RORγt gene expression in T cells restimulated 24 h. Results in H and I are representative of four independent experiments.
Figure 6.
Figure 6.
PGE2 enhances maturation of Th17 cells. Human naive CD4+ T cells were activated with anti-CD3/CD28/CD2 beads and cultured for 11 d with IL-1β and -23, in the presence or absence of PGE2. After reactivation, CD4+CCR6+ and CD4+CCR6 T cells were sorted from both cultures and cultured for 7 d in the presence of IL-2. (A) Intracellular IL-17 and IFN-γ staining after stimulation with PMA/Ionomycin. Results from three independent donors are shown. (B) Real-time PCR analysis of IL-17, IL-17F, IL-22, CCL20, IL-23R, and RORγt in T cells restimulated for 24 h. Results from five donors are shown; horizontal bars represent median values.
Figure 7.
Figure 7.
PGE2 modulates memory Th17 functions.(A) Real-time PCR analysis of EP1, EP2, EP3, and EP4 gene expression in human memory CD4+ T cells. Mean + SEM of three donors. (B–H) Memory CD4+ T cells were activated with anti-CD3/CD28/CD2 beads and cultured for 3 d in the presence or absence of IL-23, IL-1β, and/or PGE2. (B) Flow cytometric quantification of IL-23R. Box and whiskers of five independent experiments are shown. (C) Real-time PCR analysis of IL-1R1 gene expression. Results from four different donors are shown. (D) IL-17 production in cell-free supernatants. (E) Real-time PCR of RORγt gene expression. (F) IFN-γ production in cell-free supernatants. (G) Real-time PCR of T-bet gene expression. (H) IL-10 production in cell-free supernatants. Data from four (E and G) or nine (D, F, and H) independent donors are shown; horizontal bars represent median values. *, P <0.05.
Figure 8.
Figure 8.
PEG2 regulates murine Th17 cell functions. (A) Real-time PCR analysis of EP1, EP2, EP3, and EP4 gene expression in purified mouse CD4+ T cells. Closed triangle symbols represent T cells from draining lymph nodes of CFA-primed SJL mice. Open triangle symbols represent naive CD4+CD44loCD62Lhi from lymph nodes and spleen of C57BL/6 mice. Closed circle symbols represent memory CD4+CD44hiCD62Llo from C57BL/6 mice. Open circle symbols represent naive CD4+CD44loCD62Lhi from BALB/c DO11.10 OVA-TCR transgenic mice. (B, top) FACS-purified naive CD4+ T cells (CD44loCD25lo) from SJL mice were activated with anti-CD3/CD28 beads in the presence of TGF-β and IL-6 for 3 d. Cells were then restimulated for 5 d in the presence of the indicated combinations of cytokines with or without PGE2. (B, bottom) Memory CD4+ T cells (CD44hiCD25lo) were activated with anti-CD3/CD28 beads in the presence of cytokines with or without PGE2 for 4 d. IL-17 production in cell-free supernatants was assessed by ELISA and expressed as values normalized to the final number of cells per well. Results are representative of two experiments. (C) Real-time PCR analysis of IL-10 gene expression in purified mouse CD4+ T cells. Closed triangle symbols represent T cells from draining lymph nodes of CFA-primed SJL mice. Cells were cultured for 12 h with indicated cytokines with or without PGE2. Cells cultured for 2 d showed similar results (not depicted). Open triangles represent naive CD4+CD44loCD62Lhi from lymph nodes and spleen of C57BL/6 mice cultured for 1 d. Filled circles represent memory CD4+CD44hiCD62Llo from C57BL/6 mice cultured for 1 d. Open circles represent naive CD4+CD44loCD62Lhi from BALB/c DO11.10 OVA-TCR transgenic mice cultured for 2 d. SJL and BALB/c data are representative of two experiments/mouse strain, whereas results from naive and memory C57BL/6 cells are from one experiment.
Figure 9.
Figure 9.
Proposed model for PGE2 effects during Th17 cell development. (A) Binding of PGE2 to EP2 and EP4 enhances intracellular cAMP formation and signaling, leading to up-regulation of IL-23R and IL-1R1 expression, as well as inhibition of the expression of T-bet and production of IFN-γ. PGE2 binding to EP4 also induces concomitant signaling pathways independent of cAMP, such as PI3K or ERK, leading to inhibition of IL-10 production. (B) The presence of IL-23, IL-1β, and PGE2 leads to an up-regulation of RORγt, IL-17, and CCR6 expression and inhibition of IL-10. Gs, stimulatory guanine nucleotide binding protein.

Similar articles

Cited by

References

    1. Flower R.J. 2003. The development of COX2 inhibitors.Nat. Rev. Drug Discov. 2:179–191 - PubMed
    1. Harris S.G., Padilla J., Koumas L., Ray D., Phipps R.P. 2002. Prostaglandins as modulators of immunity.Trends Immunol. 23:144–150 - PubMed
    1. Weaver C.T., Hatton R.D., Mangan P.R., Harrington L.E. 2007. IL-17 family cytokines and the expanding diversity of effector T cell lineages.Annu. Rev. Immunol. 25:821–852 - PubMed
    1. Bettelli E., Oukka M., Kuchroo V.K. 2007. T(H)-17 cells in the circle of immunity and autoimmunity.Nat. Immunol. 8:345–350 - PubMed
    1. Dong C. 2006. Diversification of T-helper-cell lineages: finding the family root of IL-17-producing cells.Nat. Rev. Immunol. 6:329–333 - PubMed

MeSH terms