

Texture features from mammographic images and risk of breast cancer
- PMID: 19258482
- PMCID: PMC2674983
- DOI: 10.1158/1055-9965.EPI-08-0631
Texture features from mammographic images and risk of breast cancer
Abstract
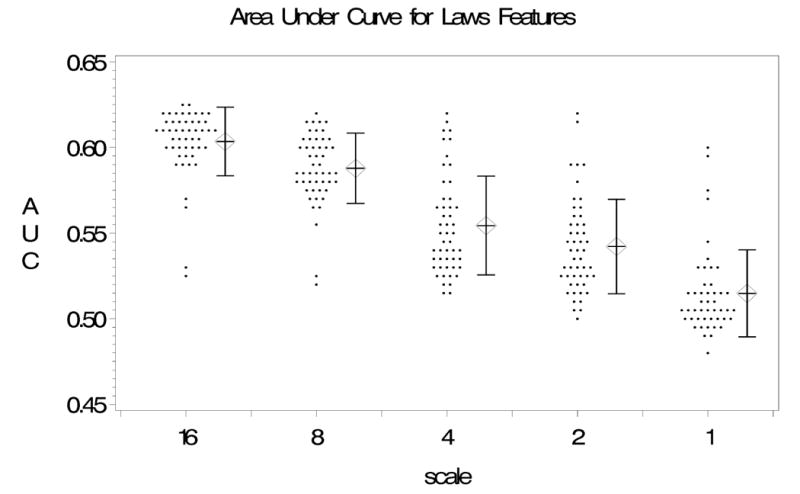
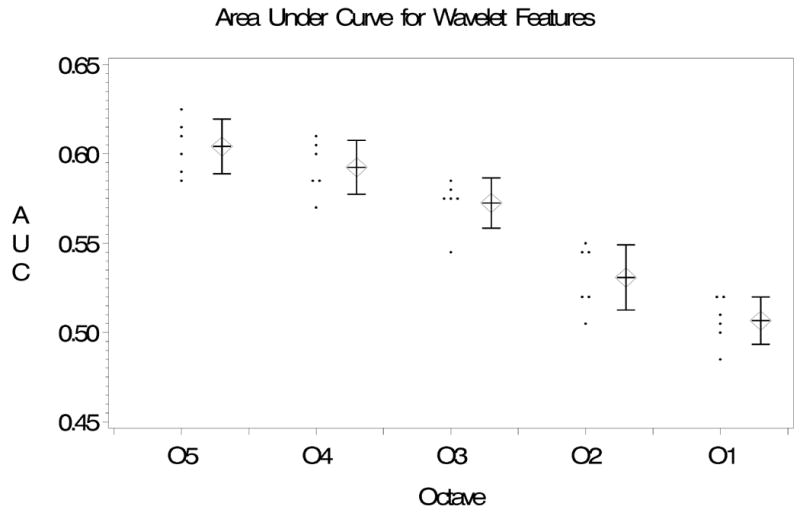
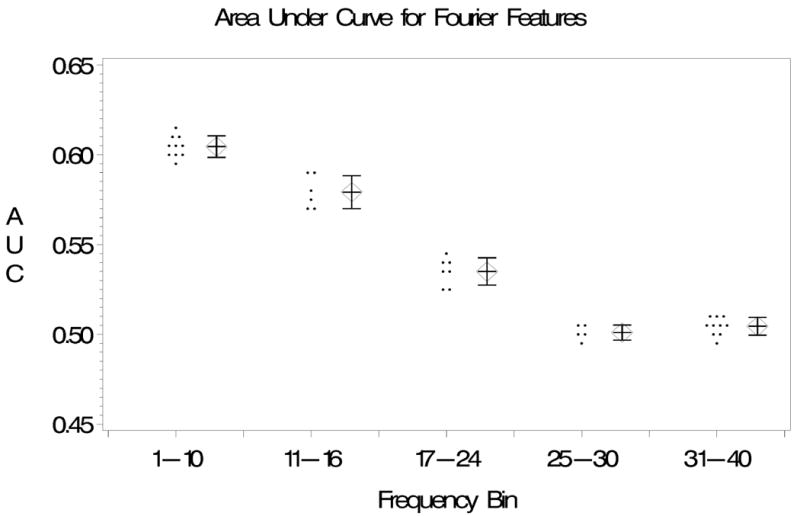
Mammographic percent density (PD) is a strong risk factor for breast cancer, but there has been relatively little systematic evaluation of other features in mammographic images that might additionally predict breast cancer risk. We evaluated the association of a large number of image texture features with risk of breast cancer using a clinic-based case-control study of digitized film mammograms, all with screening mammograms before breast cancer diagnosis. The sample was split into training (123 cases and 258 controls) and validation (123 cases and 264 controls) data sets. Age-adjusted and body mass index (BMI)-adjusted odds ratios (OR) per SD change in the feature, 95% confidence intervals, and the area under the receiver operator characteristic curve (AUC) were obtained using logistic regression. A bootstrap approach was used to identify the strongest features in the training data set, and results for features that validated in the second half of the sample were reported using the full data set. The mean age at mammography was 64.0+/-10.2 years, and the mean time from mammography to breast cancer was 3.7+/-1.0 (range, 2.0-5.9 years). PD was associated with breast cancer risk (OR, 1.49; 95% confidence interval, 1.25-1.78). The strongest features that validated from each of several classes (Markovian, run length, Laws, wavelet, and Fourier) showed similar ORs as PD and predicted breast cancer at a similar magnitude (AUC=0.58-0.60) as PD (AUC=0.58). All of these features were automatically calculated (unlike PD) and measure texture at a coarse scale. These features were moderately correlated with PD (r=0.39-0.76), and after adjustment for PD, each of the features attenuated only slightly and retained statistical significance. However, simultaneous inclusion of these features in a model with PD did not significantly improve the ability to predict breast cancer.
Conflict of interest statement
Figures
Similar articles
-
Mammographic texture resemblance generalizes as an independent risk factor for breast cancer.Breast Cancer Res. 2014 Apr 8;16(2):R37. doi: 10.1186/bcr3641. Breast Cancer Res. 2014. PMID: 24713478 Free PMC article.
-
Parenchymal texture analysis in digital mammography: A fully automated pipeline for breast cancer risk assessment.Med Phys. 2015 Jul;42(7):4149-60. doi: 10.1118/1.4921996. Med Phys. 2015. PMID: 26133615 Free PMC article. Clinical Trial.
-
Mammographic texture and risk of breast cancer by tumor type and estrogen receptor status.Breast Cancer Res. 2016 Dec 6;18(1):122. doi: 10.1186/s13058-016-0778-1. Breast Cancer Res. 2016. PMID: 27923387 Free PMC article.
-
A novel and fully automated mammographic texture analysis for risk prediction: results from two case-control studies.Breast Cancer Res. 2017 Oct 18;19(1):114. doi: 10.1186/s13058-017-0906-6. Breast Cancer Res. 2017. PMID: 29047382 Free PMC article.
-
Studies of parenchymal texture added to mammographic breast density and risk of breast cancer: a systematic review of the methods used in the literature.Breast Cancer Res. 2022 Dec 30;24(1):101. doi: 10.1186/s13058-022-01600-5. Breast Cancer Res. 2022. PMID: 36585732 Free PMC article. Review.
Cited by
-
Assessment of a Four-View Mammographic Image Feature Based Fusion Model to Predict Near-Term Breast Cancer Risk.Ann Biomed Eng. 2015 Oct;43(10):2416-28. doi: 10.1007/s10439-015-1316-5. Epub 2015 Apr 8. Ann Biomed Eng. 2015. PMID: 25851469 Free PMC article.
-
Validation of DM-Scan, a computer-assisted tool to assess mammographic density in full-field digital mammograms.Springerplus. 2013 May 24;2(1):242. doi: 10.1186/2193-1801-2-242. Print 2013 Dec. Springerplus. 2013. PMID: 23865000 Free PMC article.
-
Digital Mammography in Breast Cancer: Additive Value of Radiomics of Breast Parenchyma.Radiology. 2019 Apr;291(1):15-20. doi: 10.1148/radiol.2019181113. Epub 2019 Feb 12. Radiology. 2019. PMID: 30747591 Free PMC article.
-
The spatial distribution of radiodense breast tissue: a longitudinal study.Breast Cancer Res. 2009;11(3):R33. doi: 10.1186/bcr2318. Epub 2009 Jun 3. Breast Cancer Res. 2009. PMID: 19490643 Free PMC article.
-
Wavelet-based 3D reconstruction of microcalcification clusters from two mammographic views: new evidence that fractal tumors are malignant and Euclidean tumors are benign.PLoS One. 2014 Sep 15;9(9):e107580. doi: 10.1371/journal.pone.0107580. eCollection 2014. PLoS One. 2014. PMID: 25222610 Free PMC article.
References
-
- Warner E, Lockwood G, Tritchler D, Boyd NF. The risk of breast cancer associated with mammographic parenchymal patterns: a meta-analysis of the published literature to examine the effect of method of classification. Cancer Detect Prev. 1992;16:67–72. - PubMed
-
- Saftlas AF, Szklo M. Mammographic parenchymal patterns and breast cancer risk. Epidemiol Rev. 1987;9:146–74. - PubMed
-
- Oza AM, Boyd NF. Mammographic parenchymal patterns: a marker of breast cancer risk. Epidemiol Rev. 1993;15:196–208. - PubMed
-
- Boyd NF, Lockwood GA, Byng JW, Tritchler DL, Yaffe MJ. Mammographic densities and breast cancer risk. Cancer Epidemiol Biomarkers Prev. 1998;7:1133–1144. - PubMed
-
- Wolfe JN. Risk for breast cancer development determined by mammographic parenchymal pattern. Cancer. 1976;37:2486–92. - PubMed
Publication types
MeSH terms
Grants and funding
LinkOut - more resources
Full Text Sources
Other Literature Sources
Medical
