

Bimodal protein solubility distribution revealed by an aggregation analysis of the entire ensemble of Escherichia coli proteins
- PMID: 19251648
- PMCID: PMC2657415
- DOI: 10.1073/pnas.0811922106
Bimodal protein solubility distribution revealed by an aggregation analysis of the entire ensemble of Escherichia coli proteins
Abstract
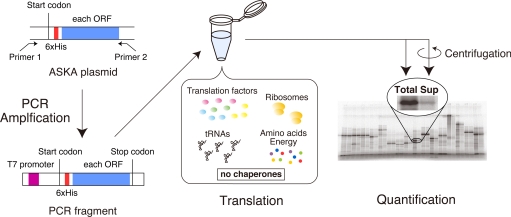
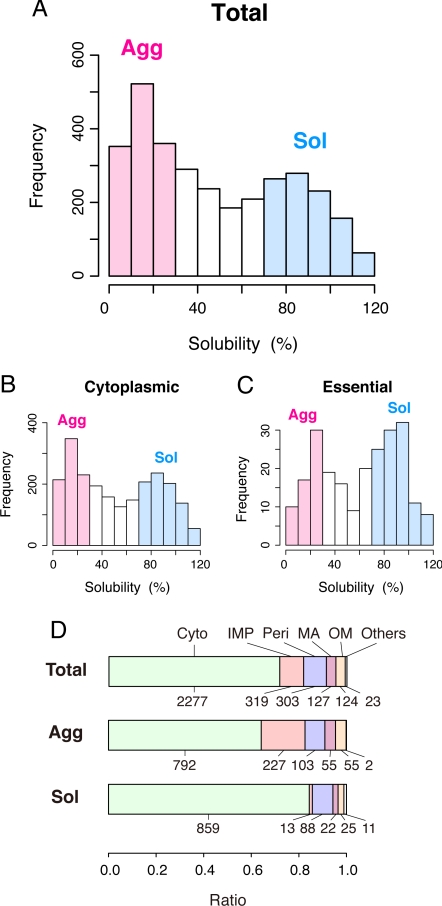
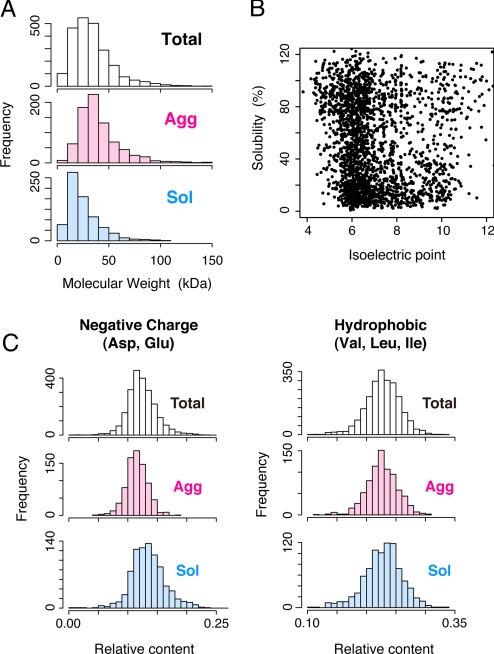
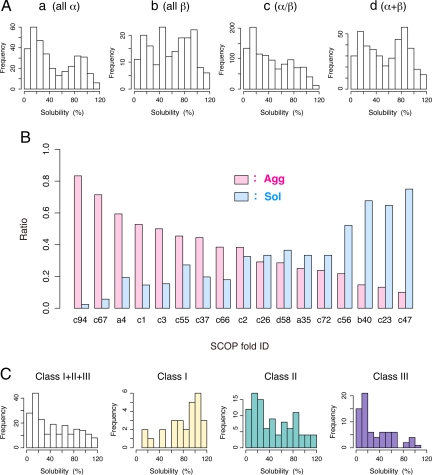
Protein folding often competes with intermolecular aggregation, which in most cases irreversibly impairs protein function, as exemplified by the formation of inclusion bodies. Although it has been empirically determined that some proteins tend to aggregate, the relationship between the protein aggregation propensities and the primary sequences remains poorly understood. Here, we individually synthesized the entire ensemble of Escherichia coli proteins by using an in vitro reconstituted translation system and analyzed the aggregation propensities. Because the reconstituted translation system is chaperone-free, we could evaluate the inherent aggregation propensities of thousands of proteins in a translation-coupled manner. A histogram of the solubilities, based on data from 3,173 translated proteins, revealed a clear bimodal distribution, indicating that the aggregation propensities are not evenly distributed across a continuum. Instead, the proteins can be categorized into 2 groups, soluble and aggregation-prone proteins. The aggregation propensity is most prominently correlated with the structural classification of proteins, implying that the prediction of aggregation propensity requires structural information about the protein.
Conflict of interest statement
The authors declare no conflict of interest.
Figures
Similar articles
-
Reconstituted Cell-free Translation Systems for Exploring Protein Folding and Aggregation.J Mol Biol. 2024 Oct 1;436(19):168726. doi: 10.1016/j.jmb.2024.168726. Epub 2024 Jul 27. J Mol Biol. 2024. PMID: 39074633 Review.
-
Proteome-level interplay between folding and aggregation propensities of proteins.J Mol Biol. 2010 Oct 8;402(5):919-28. doi: 10.1016/j.jmb.2010.08.013. Epub 2010 Aug 13. J Mol Biol. 2010. PMID: 20709078
-
Aggregation gatekeepers modulate protein homeostasis of aggregating sequences and affect bacterial fitness.Protein Eng Des Sel. 2012 Jul;25(7):357-66. doi: 10.1093/protein/gzs031. Epub 2012 Jun 15. Protein Eng Des Sel. 2012. PMID: 22706763
-
Inclusion body anatomy and functioning of chaperone-mediated in vivo inclusion body disassembly during high-level recombinant protein production in Escherichia coli.J Biotechnol. 2007 Jan 1;127(2):244-57. doi: 10.1016/j.jbiotec.2006.07.004. Epub 2006 Jul 16. J Biotechnol. 2007. PMID: 16945443
-
The remarkable solubility-enhancing power of Escherichia coli maltose-binding protein.Postepy Biochem. 2016;62(3):377-382. Postepy Biochem. 2016. PMID: 28132493 Review. English.
Cited by
-
ForceGen: End-to-end de novo protein generation based on nonlinear mechanical unfolding responses using a language diffusion model.Sci Adv. 2024 Feb 9;10(6):eadl4000. doi: 10.1126/sciadv.adl4000. Epub 2024 Feb 7. Sci Adv. 2024. PMID: 38324676 Free PMC article.
-
Solubility-Weighted Index: fast and accurate prediction of protein solubility.Bioinformatics. 2020 Sep 15;36(18):4691-4698. doi: 10.1093/bioinformatics/btaa578. Bioinformatics. 2020. PMID: 32559287 Free PMC article.
-
Reverse vaccinology approaches to design a potent multiepitope vaccine against the HIV whole genome: immunoinformatic, bioinformatics, and molecular dynamics approaches.BMC Infect Dis. 2024 Aug 28;24(1):873. doi: 10.1186/s12879-024-09775-2. BMC Infect Dis. 2024. PMID: 39198721 Free PMC article.
-
Streamlining heterologous expression of top carbonic anhydrases in Escherichia coli: bioinformatic and experimental approaches.Microb Cell Fact. 2024 Jul 2;23(1):190. doi: 10.1186/s12934-024-02463-5. Microb Cell Fact. 2024. PMID: 38956607 Free PMC article.
-
Prediction of chaperonin GroE substrates using small structural patterns of proteins.FEBS Open Bio. 2023 Apr;13(4):779-794. doi: 10.1002/2211-5463.13590. Epub 2023 Mar 14. FEBS Open Bio. 2023. PMID: 36869604 Free PMC article.
References
-
- Anfinsen CB. Principles that govern the folding of protein chains. Science. 1973;181:223–230. - PubMed
-
- Hartl FU, Hayer-Hartl M. Molecular chaperones in the cytosol: Fom nascent chain to folded protein. Science. 2002;295:1852–1858. - PubMed
-
- Ventura S, Villaverde A. Protein quality in bacterial inclusion bodies. Trends Biotechnol. 2006;24:179–185. - PubMed
-
- Dobson CM. Protein folding and misfolding. Nature. 2003;426:884–890. - PubMed
-
- Chiti F, Dobson CM. Protein misfolding, functional amyloid, and human disease. Annu Rev Biochem. 2006;75:333–366. - PubMed
Publication types
MeSH terms
Substances
LinkOut - more resources
Full Text Sources
Other Literature Sources
