

Alterations in genes of the EGFR signaling pathway and their relationship to EGFR tyrosine kinase inhibitor sensitivity in lung cancer cell lines
- PMID: 19238210
- PMCID: PMC2642732
- DOI: 10.1371/journal.pone.0004576
Alterations in genes of the EGFR signaling pathway and their relationship to EGFR tyrosine kinase inhibitor sensitivity in lung cancer cell lines
Abstract
Background: Deregulation of EGFR signaling is common in non-small cell lung cancers (NSCLC) and this finding led to the development of tyrosine kinase inhibitors (TKIs) that are highly effective in a subset of NSCLC. Mutations of EGFR (mEGFR) and copy number gains (CNGs) of EGFR (gEGFR) and HER2 (gHER2) have been reported to predict for TKI response. Mutations in KRAS (mKRAS) are associated with primary resistance to TKIs.
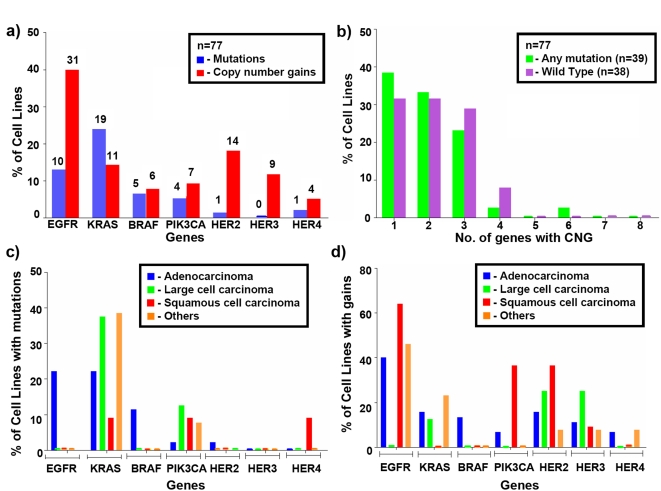
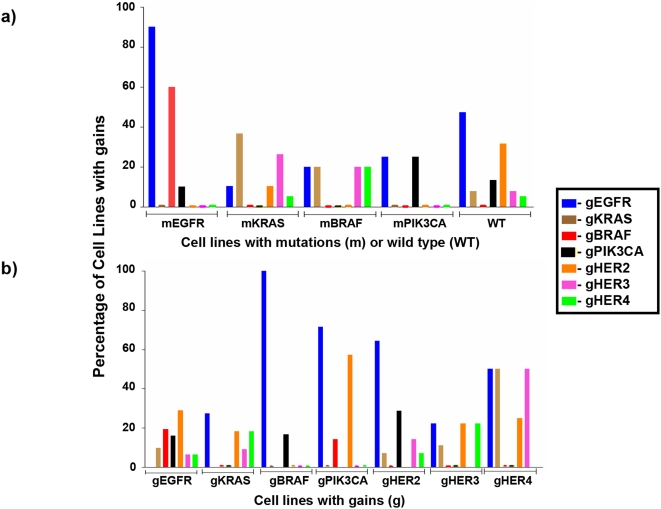
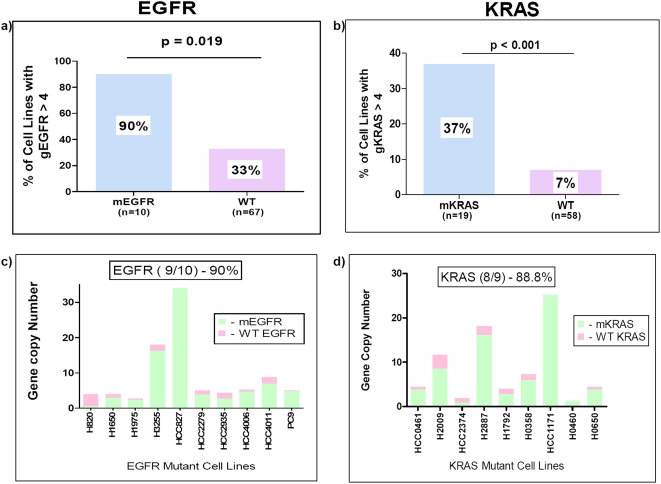
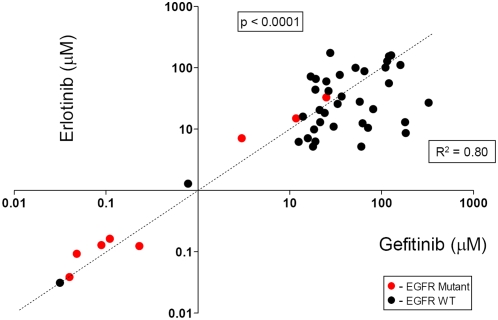
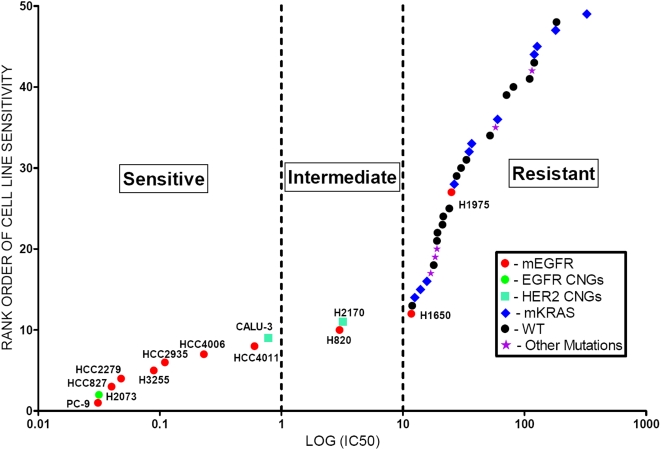
Methodology/principal findings: We investigated the relationship between mutations, CNGs and response to TKIs in a large panel of NSCLC cell lines. Genes studied were EGFR, HER2, HER3 HER4, KRAS, BRAF and PIK3CA. Mutations were detected by sequencing, while CNGs were determined by quantitative PCR (qPCR), fluorescence in situ hybridization (FISH) and array comparative genomic hybridization (aCGH). IC50 values for the TKIs gefitinib (Iressa) and erlotinib (Tarceva) were determined by MTS assay. For any of the seven genes tested, mutations (39/77, 50.6%), copy number gains (50/77, 64.9%) or either (65/77, 84.4%) were frequent in NSCLC lines. Mutations of EGFR (13%) and KRAS (24.7%) were frequent, while they were less frequent for the other genes. The three techniques for determining CNG were well correlated, and qPCR data were used for further analyses. CNGs were relatively frequent for EGFR and KRAS in adenocarcinomas. While mutations were largely mutually exclusive, CNGs were not. EGFR and KRAS mutant lines frequently demonstrated mutant allele specific imbalance i.e. the mutant form was usually in great excess compared to the wild type form. On a molar basis, sensitivity to gefitinib and erlotinib were highly correlated. Multivariate analyses led to the following results: 1. mEGFR and gEGFR and gHER2 were independent factors related to gefitinib sensitivity, in descending order of importance. 2. mKRAS was associated with increased in vitro resistance to gefitinib.
Conclusions/significance: Our in vitro studies confirm and extend clinical observations and demonstrate the relative importance of both EGFR mutations and CNGs and HER2 CNGs in the sensitivity to TKIs.
Conflict of interest statement
Figures
Similar articles
-
Distinct clinical course of EGFR-mutant resected lung cancers: results of testing of 1118 surgical specimens and effects of adjuvant gefitinib and erlotinib.J Thorac Oncol. 2012 Dec;7(12):1815-1822. doi: 10.1097/JTO.0b013e31826bb7b2. J Thorac Oncol. 2012. PMID: 23154553
-
Personalized medicine in non-small-cell lung cancer: is KRAS a useful marker in selecting patients for epidermal growth factor receptor-targeted therapy?J Clin Oncol. 2010 Nov 1;28(31):4769-77. doi: 10.1200/JCO.2009.27.4365. Epub 2010 Oct 4. J Clin Oncol. 2010. PMID: 20921461 Review.
-
Lung adenocarcinomas with HER2-activating mutations are associated with distinct clinical features and HER2/EGFR copy number gains.J Thorac Oncol. 2012 Jan;7(1):85-9. doi: 10.1097/JTO.0b013e318234f0a2. J Thorac Oncol. 2012. PMID: 22071781
-
Schedule-dependent synergistic interaction between docetaxel and gefitinib in NSCLC cell lines regardless of the mutation status of EGFR and KRAS and its molecular mechanisms.J Cancer Res Clin Oncol. 2014 Jul;140(7):1087-95. doi: 10.1007/s00432-014-1671-x. Epub 2014 Apr 13. J Cancer Res Clin Oncol. 2014. PMID: 24728492
-
Activating and resistance mutations of EGFR in non-small-cell lung cancer: role in clinical response to EGFR tyrosine kinase inhibitors.Oncogene. 2009 Aug;28 Suppl 1(Suppl 1):S24-31. doi: 10.1038/onc.2009.198. Oncogene. 2009. PMID: 19680293 Free PMC article. Review.
Cited by
-
CellLineNavigator: a workbench for cancer cell line analysis.Nucleic Acids Res. 2013 Jan;41(Database issue):D942-8. doi: 10.1093/nar/gks1012. Epub 2012 Oct 31. Nucleic Acids Res. 2013. PMID: 23118487 Free PMC article.
-
EGFR tyrosine kinase mutation testing in the treatment of non-small-cell lung cancer.Curr Oncol. 2012 Apr;19(2):e67-74. doi: 10.3747/co.19.862. Curr Oncol. 2012. PMID: 22514499 Free PMC article.
-
Is there a role for epidermal growth factor receptor tyrosine kinase inhibitors in epidermal growth factor receptor wild-type non-small cell lung cancer?World J Clin Oncol. 2015 Aug 10;6(4):45-56. doi: 10.5306/wjco.v6.i4.45. World J Clin Oncol. 2015. PMID: 26266101 Free PMC article. Review.
-
TAE226, a Bis-Anilino Pyrimidine Compound, Inhibits the EGFR-Mutant Kinase Including T790M Mutant to Show Anti-Tumor Effect on EGFR-Mutant Non-Small Cell Lung Cancer Cells.PLoS One. 2015 Jun 19;10(6):e0129838. doi: 10.1371/journal.pone.0129838. eCollection 2015. PLoS One. 2015. PMID: 26090892 Free PMC article.
-
Detecting EGFR Mutations in Patients with Non-small Cell Lung Cancer.Balkan J Med Genet. 2018 Oct 29;21(1):13-17. doi: 10.2478/bjmg-2018-0013. eCollection 2018 Jun. Balkan J Med Genet. 2018. PMID: 30425905 Free PMC article.
References
-
- Sun S, Schiller JH, Gazdar AF. Lung cancer in never smokers–a different disease. Nat Rev Cancer. 2007;7:778–790. - PubMed
-
- Jemal A, Siegel R, Ward E, Hao Y, Xu J, et al. Cancer statistics, 2008. CA Cancer J Clin. 2008;58:71–96. - PubMed
-
- Shigematsu H, Gazdar AF. Somatic mutations of epidermal growth factor receptor signaling pathway in lung cancers. Int J Cancer. 2006;118:257–262. - PubMed
-
- Rowinsky EK. The erbB family: targets for therapeutic development against cancer and therapeutic strategies using monoclonal antibodies and tyrosine kinase inhibitors. Annu Rev Med. 2004;55:433–457. - PubMed
-
- Hirsch FR, Varella-Garcia M, Bunn PA, Jr, Di Maria MV, Veve R, et al. Epidermal growth factor receptor in non-small-cell lung carcinomas: correlation between gene copy number and protein expression and impact on prognosis. J Clin Oncol. 2003;21:3798–3807. - PubMed
Publication types
MeSH terms
Substances
Grants and funding
LinkOut - more resources
Full Text Sources
Other Literature Sources
Research Materials
Miscellaneous
