. 2009;4(2):e4571.
doi: 10.1371/journal.pone.0004571. Epub 2009 Feb 24.

Transcription factor binding sites are genetic determinants of retroviral integration in the human genome

Affiliations

Transcription factor binding sites are genetic determinants of retroviral integration in the human genome

Barbara Felice et al. PLoS One. 2009.

Abstract

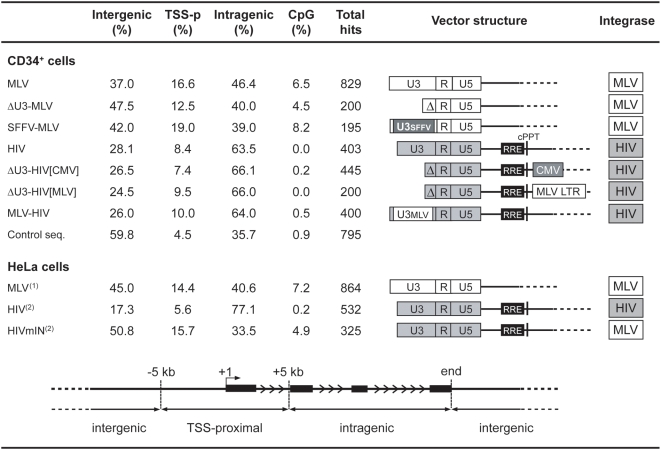
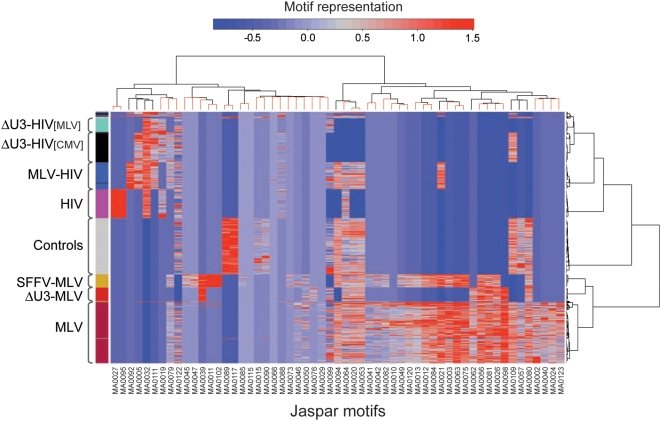
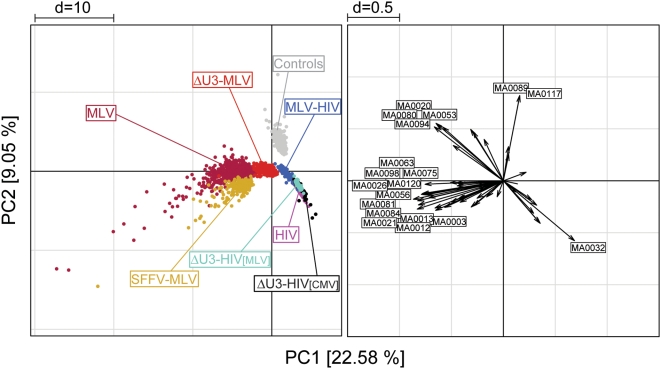
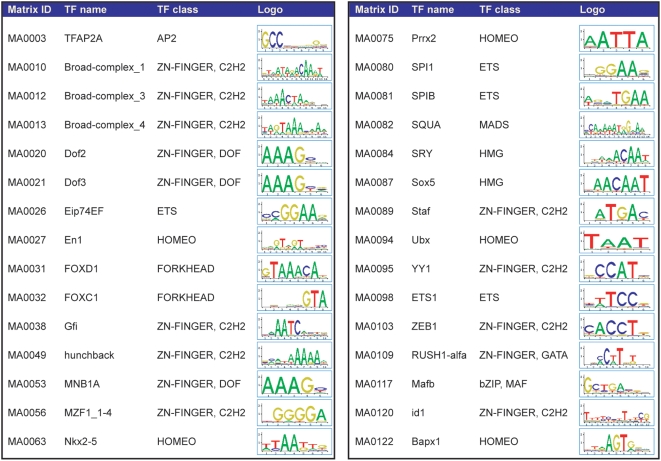
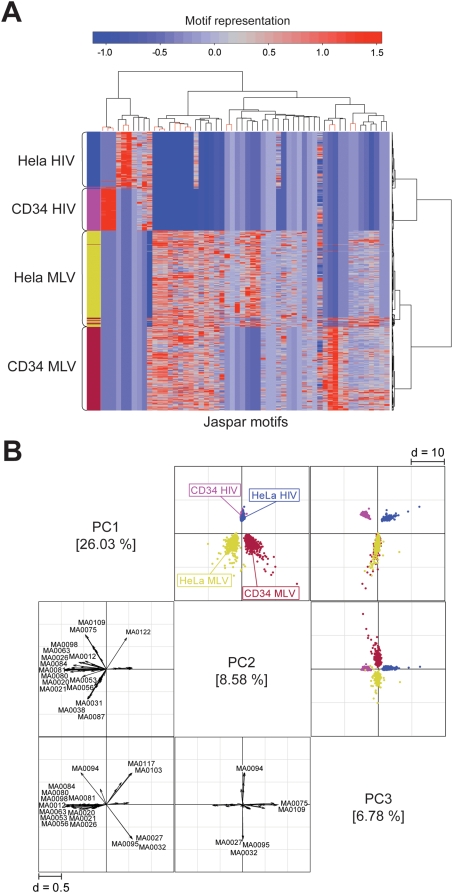
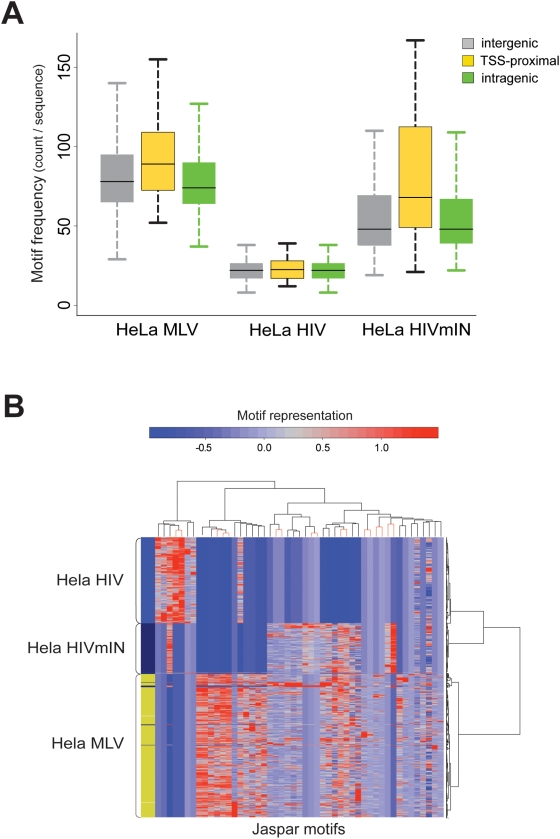
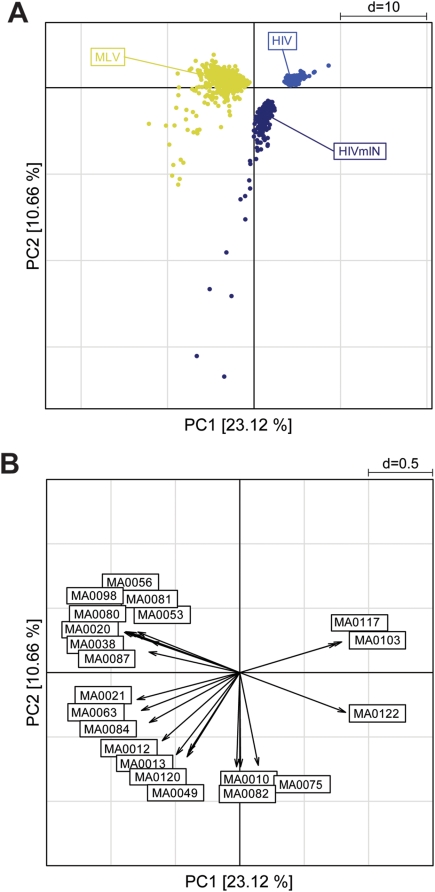
Gamma-retroviruses and lentiviruses integrate non-randomly in mammalian genomes, with specific preferences for active chromatin, promoters and regulatory regions. Gene transfer vectors derived from gamma-retroviruses target at high frequency genes involved in the control of growth, development and differentiation of the target cell, and may induce insertional tumors or pre-neoplastic clonal expansions in patients treated by gene therapy. The gene expression program of the target cell is apparently instrumental in directing gamma-retroviral integration, although the molecular basis of this phenomenon is poorly understood. We report a bioinformatic analysis of the distribution of transcription factor binding sites (TFBSs) flanking >4,000 integrated proviruses in human hematopoietic and non-hematopoietic cells. We show that gamma-retroviral, but not lentiviral vectors, integrate in genomic regions enriched in cell-type specific subsets of TFBSs, independently from their relative position with respect to genes and transcription start sites. Analysis of sequences flanking the integration sites of Moloney leukemia virus (MLV)- and human immunodeficiency virus (HIV)-derived vectors carrying mutations in their long terminal repeats (LTRs), and of HIV vectors packaged with an MLV integrase, indicates that the MLV integrase and LTR enhancer are the viral determinants of the selection of TFBS-rich regions in the genome. This study identifies TFBSs as differential genomic determinants of retroviral target site selection in the human genome, and suggests that transcription factors binding the LTR enhancer may synergize with the integrase in tethering retroviral pre-integration complexes to transcriptionally active regulatory regions. Our data indicate that gamma-retroviruses and lentiviruses have evolved dramatically different strategies to interact with the host cell chromatin, and predict a higher risk in using gamma-retroviral vs. lentiviral vectors for human gene therapy applications.


Conflict of interest statement

Competing Interests: The authors have declared that no competing interests exist.

Figures

Figure 1
Figure 1. Distribution of integration sites of different RV and LV vectors identified by LM-PCR in the genome of human CD34+ HSCs and HeLa cells.
Integration sites were annotated as ‘TSS-proximal’ when occurring within a distance of ±5 kb from the TSS of any gene, as ‘intragenic’ when occurring into a gene at a distance of >5 kb from the TSS, and as ‘intergenic’ in all other cases. The percentage of integration sites containing at least one CpG island at a distance of ±1,000 bp is also indicated (CpG %). Control sequences were randomly cloned by LM-PCR from CD34+ DNA samples. The structure of each vector is indicated in the middle-right panel: RV LTRs are indicated by white boxes, LV LTRs as grey boxes. U3, R and U5 regions are indicated in all LTRs. Δ indicates deletion of the U3 element. U3SFFV and U3MLV indicate the U3 elements of the spleen focus-forming virus and the Moloney leukemia virus LTR respectively. RRE, Rev-responsive element; cPPT, central polypurine tract; CMV, internal cytomegalovirus immediate-early promoter; MLV LTR, internal Moloney leukemia virus LTR. The origin of the integrase packaged with each vector is indicated in the rightmost column (MLV, white-boxed; HIV, grey-boxed). (1)Original sequences from Wu et al. . (2)Original sequences from Lewinski et al. .
Figure 2
Figure 2. Frequency of TFBSs in genomic sequences flanking (±1.0 kb) integration sites of different RV and LV vectors (identified in Figure 1) in human HSCs.
(A) Box plot of the frequency of TFBSs (motif count per sequence) in different sequence sets. Motifs derive from the JASPAR Core 2005 collection of matrix-based, non-redundant, experimentally validated TFBS motifs. Two-sample test (Wilcoxon rank sum test) statistics of the frequency comparisons among all sequence groups are reported in Table S2. p values of some significant comparisons are highlighted. (B) Box plot of the frequency of TFBSs (motif count per sequence) around intergenic (grey), TSS-proximal (yellow), and intragenic (green) integrations.
Figure 3
Figure 3. Unsupervised, two-way hierarchical cluster analysis of the relative frequency of TFBS motifs around integration sites of different RV and LV vectors (identified in Figure 1) in human HSCs.
The heatmap, computed with likelihood ratio values derived from the Clover analysis of motif representation, indicates the relative frequency by which each motif (columns) is represented in each sequence (rows) (red, over-representation; blu, under-representation). Motifs are identified by the JASPAR ID at the bottom (complete list in Table S3). The row dendrogram (right) identifies three main branches corresponding to MLV, Control and HIV sequences. The bootstrapped column dendrogram (top) splits the dataset in two main branches, segregating RV from LV and Control sequences. Red branches on the tree identify “stable” nodes with an Approximately Unbiased (AU) test p-value>0.95 (detailed dendrogram in Figure S1).
Figure 4
Figure 4. Principal component analysis of likelihood ratio values from the Clover analysis for 57 enriched TFBS motifs.
A scatter plot of the first two components, accounting for 31.6% of the total variability (left panel), shows three main groups: RV sequences (MLV, SFFV-MLV and ΔU3-MLV), LV sequences (HIV, ΔU3-HIV[CMV], ΔU3-HIV[MLV], and the hybrid MLV-HIV), and Control sequences. The first component (x-axis) discriminates between RV and all other sequences, the second component (y-axis) between LV and Control sequences. ΔU3-MLV sequences, containing a lower number of TFBSs, show less variability than the MLV and MLV-SFFV sequences, but are still oriented towards the RV group along the first component axis. A plot of 19 loading vectors having a value higher than the chosen cutoff (right panel) shows one vector (motif ID: MA0032) oriented with the LV group, two (MA0117 and MA0089) with the Control group, and the remaining ones with the RV group. The four motifs (MA0056, MA0081, MA0026 and MA0098) strongly associated with RV sequences in the cluster analysis (AU values = 100) are contained in this group. All motifs are identified in Figure 5.
Figure 5
Figure 5. Summary table of all over-represented TFBS motifs emerging from PCA analyses reported in Figures 4, 7 and 9.
For each motif, identified by its JASPAR ID, the table specifies the name of the associated transcription factor (TF), the class to which the TF belongs, and the relative consensus sequence (Logo).
Figure 6
Figure 6. Analysis of the frequency of evolutionarily conserved TFBSs in the sequences flanking the integration sites of different RV and LV vectors (identified in Figure 1) in human HSCs.
Motifs derive from the TFBS Conserved Track at the UCSC Genome Browser, which includes 188 motifs from the TRANSFAC Matrix Database (v 7.0) conserved in a human-mouse and/or -rat genome alignment. In the upper panel, data are plotted as percentage of sequences containing at least one conserved motif. Each group of sequences (light blue bars) is compared to a weighted background (BG, red bars) and a random computational control sequence set (blue bars) (see methods for definitions). Asterisks highlight experimental groups that show a significant enrichment of frequency compared to control sets (one-sided Fisher test; complete statistics in Table S4). In the lower panel, frequency data are broken down into three subgroups according to the integration site annotation, i.e., intergenic (gray bars), TSS-proximal (yellow bars), and intragenic (green bars). The complete list of conserved motifs and their distribution in the different datasets are reported in Table S5.
Figure 7
Figure 7. Frequency and distribution of TFBSs in genomic sequences flanking integration sites (+/−1.0 kb) of RV and LV vectors (identified in Figure 1) in HSCs and HeLa cells.
(A) Two-way hierarchical cluster analysis (see Figure 3 for definitions). The row dendrogram (right) splits the dataset in two branches (MLV and HIV), within which HSC and HeLa sequences are clearly separated. The bootstrapped column dendrogram (top) split the cluster in two nodes, mainly related to the HIV and the MLV profile (detailed dendrogram in Figure S1, complete list of motifs in Table S3). (B) Principal component analysis of likelihood ratio values from the Clover analysis. The scatter plots (upper-right, colored squares) of the first three principal components, accounting for 41.4% of the total variability, and the corresponding loading plots (lower-left, b/w squares) were combined. On the scatter plots, the first source of variability is the vector type: MLV and HIV sequences distribute on the first component in opposite direction. The second and third sources of variability are the cell context within MLV and HIV sequences respectively. The loading plots show that motifs that better explain this specific behavior are the same identified in the hierarchical cluster analysis (panel A and Figure S1) Motifs are identified in Figure 5.
Figure 8
Figure 8. Analysis of the role of the MLV integrase in retroviral target site selection.
(A) Box plot of the frequency of TFBS motif from the JASPAR database (motif count per sequence) around intergenic, TSS-proximal, and intragenic integration sites in HeLa cells of an MLV vector, an HIV vector, and an HIV vector packaged with an MLV integrase (HIVmIN) (vectors are identified in Figure 1). Two-sample test (Wilcoxon rank sum test) statistics of the frequency comparisons among and within groups is reported in Table S2. (B) Two-way hierarchical cluster analysis (see Figure 3 for definitions). The row dendrogram (right) clearly separates MLV and HIV sequences. TFBSs are under-represented in HIV sequences compared to MLV sequences, while sequences from the HIVmIN vector share a 7–motif branch with those of the MLV vector in the column dendrogram (detailed dendrogram in Figure S1, complete list of motifs in Table S3).
Figure 9
Figure 9. Principal component analysis of likelihood ratio values from the Clover analysis of the 49 JASPAR motifs enriched around integration sites of an MLV vector, an HIV vector and an HIV vector packaged with an MLV integrase (HIVmIN) in HeLa cells.
(A) The scatter plot of the first two PCs (assessing 33.78% of total variability) reveals three main groups, corresponding to the vector type. The first component, accounting for 23.12% of the total variability, discriminates MLV from HIV sequences. The second component discriminates HIV from HIVmIN sequences but does not distinguish MLV from HIVmIN sequences. (B) The corresponding loading plot shows a set of MLV-specific motifs (MA0056, MA0098, MA0081, MA0080, MA0053, MA0020, MA0038 and MA0087), and a second group of motifs in common between HIVmIN and MLV sequences (MA0084, MA0063, MA0021, MA0012, MA0120, MA0013 and MA0049). All motifs are identified in Figure 5.

Similar articles

Cited by

References

    1. Coffin JM, Huges SH, Varmus HE. Retroviruses. Cold Spring Harbor, NY: Cold Spring Harbor Laboratory Press; 1997. - PubMed
    1. Schroder AR, Shinn P, Chen H, Berry C, Ecker JR, et al. HIV-1 integration in the human genome favors active genes and local hotspots. Cell. 2002;110:521–529. - PubMed
    1. Wu X, Li Y, Crise B, Burgess SM. Transcription start regions in the human genome are favored targets for MLV integration. Science. 2003;300:1749–1751. - PubMed
    1. Mitchell RS, Beitzel BF, Schroder AR, Shinn P, Chen H, et al. Retroviral DNA integration: ASLV, HIV, and MLV show distinct target site preferences. PLoS Biol. 2004;2:E234. - PMC - PubMed
    1. Bushman FD. Targeting survival: integration site selection by retroviruses and LTR-retrotransposons. Cell. 2003;115:135–138. - PubMed

Publication types