. 2009 Mar;27(3):264-74.
doi: 10.1038/nbt.1526. Epub 2009 Feb 22.

A conditional transposon-based insertional mutagenesis screen for genes associated with mouse hepatocellular carcinoma

Affiliations

A conditional transposon-based insertional mutagenesis screen for genes associated with mouse hepatocellular carcinoma

Vincent W Keng et al. Nat Biotechnol. 2009 Mar.

Abstract

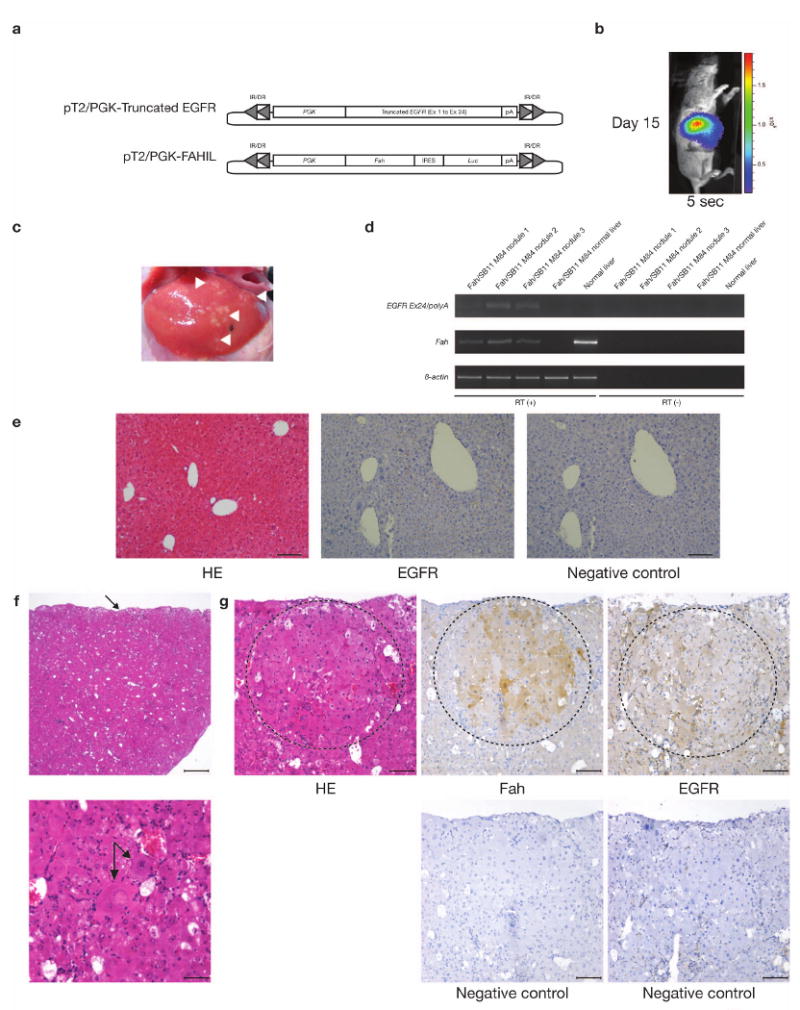
We describe a system that permits conditional mobilization of a Sleeping Beauty (SB) transposase allele by Cre recombinase to induce cancer specifically in a tissue of interest. To demonstrate its potential for developing tissue-specific models of cancer in mice, we limit SB transposition to the liver by placing Cre expression under the control of an albumin enhancer/promoter sequence and screen for hepatocellular carcinoma (HCC)-associated genes. From 8,060 nonredundant insertions cloned from 68 tumor nodules and comparative analysis with data from human HCC samples, we identify 19 loci strongly implicated in causing HCC. These encode genes, such as EGFR and MET, previously associated with HCC and others, such as UBE2H, that are potential new targets for treating this neoplasm. Our system, which could be modified to drive transposon-based insertional mutagenesis wherever tissue-specific Cre expression is possible, promises to enhance understanding of cancer genomes and identify new targets for therapeutic development.


Figures

Figure 1
Figure 1
Accelerated tumorigenesis in p53-deficient livers compared with wild-type livers. (a) Albumin-Cre (Alb-Cre) efficiently deletes the floxed-stop (lsl) cassette within the Rosa26-lsl-SB11 transgene, allowing for SB transposase expression and subsequent somatic transposition events. Left panel, immunohistochemistry (IHC) of (Alb-Cre; Rosa26-lsl-SB11) double-transgenic liver section treated without the primary antibody (negative control). Right panel, IHC of serial liver section treated with the primary anti-SB transposase antibody. Sections were lightly stained with hematoxylin after IHC. Scale bar, 100 μm. (b) Quadruple male transgenic mouse liver at 159-days, displaying many preneoplastic nodules (left panel, scale bar, 0.5 cm). Middle (low magnification) and right (high magnification of boxed area from middle panel) panels show the tumor histology of large preneoplastic nodules using hematoxylin-eosin (HE) staining. These proliferative lesions were often compressing surrounding parenchyma and the cells within the preneoplastic foci and adenomas were frequently vacuolated, containing distinct lipid vacuoles or clear cytoplasm (arrows). Nuclei were equal to or smaller in size than those in the normal hepatic parenchyma, and occasionally contained mitotic figures indicative of cell division. Proliferative lesions were frequently bordered by hepatocytes with markedly enlarged nuclei that were occasionally karyomegalic. T, preneoplastic tumor nodule; P, parenchymal liver cells; scale bars for middle and right panels were 500 μm and 100 μm, respectively. (c) Triple-transgenic male experimental mouse liver at 330-days showing advanced tumor development. Note the many large irregular nodules showing a hypervascular phenotype (left panel, scale bar, 0.5 cm). Middle panel shows the HE histological section of one large neoplastic nodule typical of hepatocellular adenoma consisting of variably vacuolated hepatocytes filled with lipid. Three black arrows indicate border between adenoma and non-neoplastic hepatic parenchyma (P), which is slightly compressed. Right panel shows high magnification of boxed area in the middle panel. Note enlarged nuclei of hepatocytes with moderate variation in nuclear size, prominent nucleoli, and mitotic figure (open arrow). T, preneoplastic tumor nodule; P, parenchymal liver cells; scale bars for middle and right panels were 1000 μm and 50 μm, respectively. (d) Triple-transgenic male experimental mouse at 440-days with HCC (bottom, left panel) and lung metastasis (top, left panel). HE staining of the liver (middle panel) and lung (right panel), showing advanced HCC in the liver and its metastases into the lung. A partial HCC section composed of irregular trabeculae of neoplastic, diffusely necrotic hepatocytes (black arrows) that are multifocally vacuolated. Trabeculae are separated by dilated sinusoids containing variable amount of fibrin. The lung contains multiple variably sized metastatic nodules of HCC (black arrows) that markedly compress the pulmonary parenchyma. Pulmonary alveoli are filled with large numbers of foamy macrophages. Scale bar, 100 μm.
Figure 2
Figure 2
Immunohistochemical (IHC) analyses of liver preneoplastic nodules. (a) Paraffin-embedded liver tissue sections were stained with antibodies against SB transposase (SB), Albumin (Alb) and for the proliferative marker, Ki67. All liver tumor sections taken from either triple- or quadruple-transgenic experimental male animals were positive for SB, Alb and Ki67. Representative IHC liver sections from a 160-day old quadruple transgenic male mouse are shown. Top panels, negative control of liver sections not treated with the primary antibody; Bottom panels, IHC of serial liver sections treated with the indicated primary antibody; T, preneoplastic nodule; P, parenchymal cells; scale bars, 100 μm. (b) IHC analyses of the HCC-derived lung metastasis. Paraffin-embedded lung tissue sections were stained with antibodies against SB, Alb and Ki67. Top panels, negative control of lung sections not treated with the primary antibody; bottom panels, IHC of serial lung sections treated with the indicated primary antibody; P, parenchymal lung cells; M, metastasis from HCC; scale bars, 100 μm.
Figure 3
Figure 3
Frequent mutagenic transposon insertions into Epidermal growth factor receptor (Egfr) and Egfr interacting genes. (a) Ingenuity pathway analysis using 17 of the CIS genes obtained from the liver cancer screen. Out of the 17 genes entered, 10 genes were referenced and displayed in the network function pathways associated with post-translational modification, cancer and tumor morphology. The EGFR signaling pathway showing interactions with JNK, TNF and PI3K/AKT regulatory pathways is shown. CIS genes are in black and other genes in this network are in blue. (b) Diagrammatic representation of transposon insertions into intron 24 of Egfr. Schematic representation of the mutagenic transposon (T2/onc) is shown. Red triangles, inverted repeats/direct repeats (IR/DR) transposon flanking sequences; SA, splice acceptor; polyA, polyadenalytion signal; MSCV, LTR of the murine stem cell virus; SD, splice donor; open arrowhead, sense orientated insertion of the T2/onc relative to the Egfr gene; arrowhead anti-sense orientated insertion of the T2/onc relative to the Egfr gene; arrows, endogenous and vector primers used for the Egfr PCR genotyping shown in (c); numbers in parentheses, indicate the frequency of transposon insertions at each particular site from different liver preneoplastic nodules of experimental animals. (c) Confirming transposon insertions in intron 24 of Egfr. PCR genotyping was performed using genomic DNA isolated from individual tumor nodules. A subset of these samples was subjected to Egfr PCR genotyping using endogenous and vector primers. Resulting gel electrophoresis shows the endogenous Egfr (713 bp) band (open arrowhead), with the transposon-integrated band of varying sizes depending on the insertion site within intron 24. All amplicons corresponded with the pyrosequencing data except for 2 insertion sites (asterisks) that were missed by pyrosequencing. MW, 100-bp molecular standard; B6, C57BL/6 tail genomic DNA; H2O, double-distilled water used as a negative control. (d) RT-PCR analyses of tumor nodules using various markers. All neoplastic nodules were positive for SB transposase (SB) and Albumin (Alb) transcripts, indicating that transposition events are occurring and nodules were from a hepatocyte origin, respectively. A majority of tumor nodules were positive for Alpha-fetoprotein (Afp) transcripts, a clinical marker for HCC, and Osteopontin (Opn), which is over-expressed in various cancers including HCC. Nodules taken from a 330-day triple-transgenic mouse with advanced tumors (shown in Fig. 1c) were strongly positive for Afp and Opn. All tumor nodules tested were positive for endogenous Egfr and for truncated-Egfr transcripts. NRAS liver tumor, HCC control taken from a tumorigenic liver over-expressing NRAS G12V oncogene; SB normal liver, normal liver taken from a SB transposase-expressing mouse; β-actin, control to show equal loading of mRNA used for RT-PCR. RT-negative controls were also performed for each sample and no visible bands were seen for any of the markers tested (data not shown). (e) Confirming for transposition events and transposon insertions in intron 24 of Egfr for HCCs and lung metastases. PCR genotyping was performed with genomic DNA isolated from the tails, livers and lung metastases of two triple male transgenic mice (ATR M71, 440-days and ATR M81, 460-days). Top panel shows the excision PCR assays (Ex) for transposition events in the lung metastases and HCCs (open arrowhead). No excision was detected in the tails of the triple male transgenic mice. Middle panel shows the PCR genotyping using only the endogenous Egfr forward and T/JB3 primers (T2/onc/Egfr) to confirm for transposon insertion in intron 24 of Egfr for the lung metastases and HCCs. Resulting gel electrophoresis demonstrates the transposon-integrated band (arrowhead) for both the lung metastases (lung) and HCCs (liver), but not in their tails. Gapdh, demonstrate equal genomic DNA template loading (100 ng) used for PCR reaction. Nodule, a different liver tumor nodule was used to compare between different transposon insertion site; MW, 100-bp molecular standard; B6, C57BL/6 tail genomic DNA; H2O, double-distilled water used as a negative control.
Figure 4
Figure 4
Using SB-induced tumorigenesis to derive clonal relationships between primary and metastatic derivatives. (a) Heat-map showing the clonal relationship between lung metastases and HCC samples. Heat-map was generated by mapping insertion sites from 32 lung metastases nodules and 3 HCC nodules taken from the same experimental mouse (ATRP M232). Importantly, 3 additional insertion mutations were common in most of the metastases, indicating potential genes involved with the metastatic process. Red, insertion detected at the indicated locus; Black, no insertion detected at the indicated locus. (b) Phylogenic tree generated from the insertion sites of the lung metastases and HCCs.
Figure 5
Figure 5
Validating the oncogenic potential of truncated EGFR using the Fumarylacetoacetate hydrolase (Fah)-deficient mouse model. (a) Vectors used for tail vein hydrodynamic injection. pT2/PGK-Truncated EGFR, truncated EGFR cDNA (exon 1 to exon 24) placed under the control of the Phosphoglycerate kinase (PGK) promoter and flanked by SB inverted repeat/direct repeat (IR/DR) recognition sequences essential for transposition. pT2/PGK-FAHIL, Fumaryl acetoacetate hydrolase (Fah) cDNA placed under the control of the PGK promoter fused with an IRES-Luciferase (Luc) reporter gene, flanked by SB IR/DRs. (b) Luciferase activity in Fah/SB11 M84 taken 15-days post-injected with pT2/PGK-Truncated EGFR and pT2/PGK-FAHIL. Exposure time was 5-seconds. (c) Validating the tumorigenic potential of truncated EGFR using the Fah-deficient mouse model. At 43-days post-hydrodynamic injection, Fah/SB11 M84 was killed and the abdominal cavity opened, revealing many patches of small hyperplastic liver nodules (arrowheads). These nodules were carefully removed for RNA extraction and subsequent RT-PCR analyses. Adjacent normal liver tissue was also extracted for comparison. (d) RT-PCR analyses of the liver nodules and adjacent normal tissue. Liver hyperplastic nodules were expressing both Fah and the truncated form of EGFR, while the adjacent normal tissue was negative for both transcripts. RT (+), first strand cDNA synthesis with reverse transcriptase added; RT (−), first strand cDNA synthesis without reverse transcriptase. (e) Normal histology of Fah-deficient liver (hematoxylin-eosin stain, HE) and lack of EGFR detectable by immunohistochemical (IHC) staining. EGFR, treated with EGFR primary antibody; Negative control, serial section not treated with the indicated primary antibody. Scale bars, 100 μm. (f) Histology of liver hyperplastic nodules induced by truncated form of EGFR. Top HE panel, capsular surface of the liver was irregularly nodular (arrow) but overall hepatic architecture was preserved with regularly spaced central veins and portal tracts. Scale bar, 500 μm. Bottom HE panel, a portion of hepatic lobule containing variably sized hepatocytes with 2 cytomegalic and karyomegalic hepatocytes in the center one of which is binucleated (arrows). Occasional hepatocytes have vacuolated cytoplasm. Hepatic cords are not evident due to cellular crowding. Scale bar, 50 μm. (g) Hyperplastic nodule (enclosed within dashed circular line) within hepatic parenchyma consisted of closely packed sheets of variably sized hepatocytes including a karyomegalic cell. Note mild compression of surrounding hepatic parenchyma. There was low degree of inflammation represented by scattered neutrophils and lymphocytes and mild extramedullary hematopoiesis. IHC analyses of serial liver sections treated with the indicated primary antibody confirmed the co-expression of Fah and EGFR in liver nodules. Most of the hepatocytes within hyperplastic nodule (enclosed within dashed circular line) expressed Fah. Hepatocytes within hyperplastic nodule (enclosed within dashed circular line) and within surrounding parenchyma stained weakly for EGFR. EGFR staining is also prominent in the cytoplasmic membranes of cells bordering sinusoids. Negative control, serial sections not treated with the indicated primary antibody. Scale bars, 100 μm.

Comment in

Similar articles

Cited by

References

    1. Spradling AC, et al. Gene disruptions using P transposable elements: an integral component of the Drosophila genome project. Proc Natl Acad Sci U S A. 1995;92:10824–10830. - PMC - PubMed
    1. Bellen HJ, et al. P-element-mediated enhancer detection: a versatile method to study development in Drosophila. Genes Dev. 1989;3:1288–1300. - PubMed
    1. Ivics Z, Hackett PB, Plasterk RH, Izsvak Z. Molecular reconstruction of Sleeping Beauty, a Tc1-like transposon from fish, and its transposition in human cells. Cell. 1997;91:501–510. - PubMed
    1. Dupuy AJ, Fritz S, Largaespada DA. Transposition and gene disruption in the male germline of the mouse. Genesis. 2001;30:82–88. - PubMed
    1. Horie K, et al. Efficient chromosomal transposition of a Tc1/mariner- like transposon Sleeping Beauty in mice. Proc Natl Acad Sci U S A. 2001;98:9191–9196. - PMC - PubMed

Publication types

MeSH terms