. 2009 Apr 10;513(5):511-31.
doi: 10.1002/cne.21969.

Dynamic gene and protein expression patterns of the autism-associated met receptor tyrosine kinase in the developing mouse forebrain

Affiliations

Dynamic gene and protein expression patterns of the autism-associated met receptor tyrosine kinase in the developing mouse forebrain

Matthew C Judson et al. J Comp Neurol. .

Abstract

The establishment of appropriate neural circuitry depends on the coordination of multiple developmental events across space and time. These events include proliferation, migration, differentiation, and survival-all of which can be mediated by hepatocyte growth factor (HGF) signaling through the Met receptor tyrosine kinase. We previously found a functional promoter variant of the MET gene to be associated with autism spectrum disorder, suggesting that forebrain circuits governing social and emotional function may be especially vulnerable to developmental disruptions in HGF/Met signaling. However, little is known about the spatiotemporal distribution of Met expression in the forebrain during the development of such circuits. To advance our understanding of the neurodevelopmental influences of Met activation, we employed complementary Western blotting, in situ hybridization, and immunohistochemistry to comprehensively map Met transcript and protein expression throughout perinatal and postnatal development of the mouse forebrain. Our studies reveal complex and dynamic spatiotemporal patterns of expression during this period. Spatially, Met transcript is localized primarily to specific populations of projection neurons within the neocortex and in structures of the limbic system, including the amygdala, hippocampus, and septum. Met protein appears to be principally located in axon tracts. Temporally, peak expression of transcript and protein occurs during the second postnatal week. This period is characterized by extensive neurite outgrowth and synaptogenesis, supporting a role for the receptor in these processes. Collectively, these data suggest that Met signaling may be necessary for the appropriate wiring of forebrain circuits, with particular relevance to the social and emotional dimensions of behavior.


Figures

Fig. 1
Fig. 1
Western blotting analysis of Met protein expression during forebrain development in wild type mice. The temporal profile of Met expression is strikingly similar regardless of the forebrain region assayed: protein levels are relatively low embryonically (E16), but increase dramatically during perinatal development (P0) to reach a peak at P7. Levels remain high through the second postnatal week (P14), but decline dramatically thereafter (P21) to relatively low levels in the adolescent (P35) and adult (>P90). Note that peak periods of Met expression overlap with principal periods of neurite outgrowth and synaptogenesis in the mouse forebrain. Samples from each forebrain region were probed on separate blots and optimal film exposure times were independently determined.
Fig. 2
Fig. 2
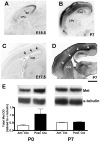
A transient tangential gradient of Met transcript and protein expression in the early postnatal neocortex. In situ hybridization analysis of Met in sagittal sections of wild type forebrain reveals a strong posterior (high) - anterior (low) gradient of signal in the neocortex, which is present at E18.5 (A), but normalizes by P7 (B). DIC photomicrographs of Met immunoreactivity in wild type sagittal sections show increased axonal labeling (arrows) in the posterior neocortex at E17.5 (C), but distributed axonal (arrows) and neuropil labeling throughout the anteroposterior extent by P7 (D). Semiquantitative Western blotting confirms the protein gradient revealed by immunohistochemistry; Met protein levels are found on average to be approximately three-fold greater in posterior versus anterior neocortex at P0 but not P7 (E). Error bars in E represent reflect standard error of the mean, N = 3 in each group. Scale bar = 925μm for A, 1.75mm for B, 550 μm for C and 1.1 mm for D.
Fig. 3
Fig. 3
Laminar patterning of Met transcript and protein expression in the neocortex. A, D, G: Autoradiographic images of Met transcript in coronal sections from wild type mice, scanned from film. B, E, H: DIC photomicrographs of coronal sections from wild type mice after processing for autoradiography and emulsion-dipping. C, F, I: DIC photomicrographs of Met immunoreactivity in coronal sections from wild type mice. At birth, low levels of Met transcript (A,B) and protein (C) are present throughout the extent of the neocortex, but a bi-laminar pattern of expression is emerging. By P7 (D,E,F), laminar patterning is apparent, with a distinct absence of Met signal in layer IV. This pattern of transcript expression is maintained at P14 (G,H), but immunohistochemical signal is reduced at this age (I). Scale bar = 1.55mm for A,D,G; 275μm for B,C,F,I; 550μm for E,H.
Fig. 4
Fig. 4
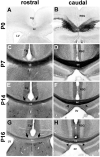
Met protein expression in the corpus callosum. DIC photomicrographs show Met immunoreactivity in coronal sections from wild type mice. At P0 (A, B), Met immunoreactivity is observed in the caudal portion of the corpus callosum, but not in the rostral region. By P7 (C, D), Met expression is intense throughout the rostro-caudal extent of the tract. Expression remains high, but gradually declines at P14 (E,F) and P16 (G,H). Note that at P14 and P16, Met immunoreactivity is enriched in dorsally situated axons at rostral levels (arrows) and ventrally situated axons at caudal levels (arrowheads). Scale bar = 275μm for all panels.
Fig. 5
Fig. 5
Met transcript and protein expression in the piriform cortex and anterior commissure. A-C: Autoradiographic images of piriform cortex at E18.5, P7, and P14 show Met transcript expression. DIC photomicrographs show Met immunoreactivity in coronal sections from wild type (D,E,F) and Emx1cre/Metfx/fx (D’, E’, F’) mice. In the wild type sections, Met is expressed in both the anterior and posterior limbs of the commissure, though the staining is more intense in the posterior limb. Met immunoreactivity is largely depleted in both limbs in the Emx1cre/Metfx/fx sections, owing to their dorsal pallial origin. We note residual staining in the P0 and P7 posterior limb (D’,E’), likely due to a contribution from fibers originating in the ventral endopiriform cortex in which Emx1-mediated Cre recombination rates are low. Scale bar = 825μm for A-C; 275μm for D-F and D’-F’.
Fig. 6
Fig. 6
DIC photomicrographs illustrate Met immunohistochemistry in the internal capsule and cerebral peduncle in coronal sections from wild type and Emx1cre/Metfx/fx mice. Staining of internal capsule fibers is apparent in P0 and P7 wild type mice (A,C) but essentially absent in matched sections from Emx1cre/Metfx/fx mice (A’,C’). At P7, note the increase in Met immunoreactivity in the underlying striatal neuropil but the absence of such staining in the globus pallidus. By P14 (E) and P16 (F), the internal capsule fibers are nearly devoid of Met staining, but there is remaining immunoreactivity in the striatal neuropil. The paucity of Met labeling in the cerebral peduncle at all ages examined (P0, B; P7, D; P14, G; P16, H) suggests that cortico-tectal, -bulbar, and -spinal fibers contribute minimally to the Met immunoreactivity in the internal capsule. (Scale bar = 410μm for A,A’,B,C,C’,D; 550μm for E-H.
Fig. 7
Fig. 7
Met transcript and protein expression in the hippocampus. A-C: Autoradiographic images of Met transcript in coronal sections from wild type mice, scanned from film. At all ages, autoradiographic signal is observed in the stratum pyramidale of the subiculum, CA1, and a subregion of CA3. Signal is absent in the dentate gyrus (DG). D-O: DIC photomicrographs of Met immunoreactivity in coronal sections from wild type (D-K) and Emx1cre/Metfx/fx (L-O) mice. D and E: DIC images of Met immunoreactivity from wild type mice show robust staining of the alveus and fimbria/fornix at P0 (D) and P7 (E), indicating that efferent axons of hippocampal pyramidal cells express Met. This staining decreases at later ages (P14, F; P16, G). Light staining in the strata oriens and radiatum and heavier staining in the stratum moleculare is observed in wild type (H), but not Emx1cre/Metfx/fx (L), mice at P7. Heavy Met staining is present in the dorsal hippocampal commissure (I), ventral hippocampal commissure (J), precommissural fornix (J), and postcommissural fornix (K). This staining is completely absent in corresponding axon tracts in the Emx1cre/Metfx/fx mouse (M, N, and O). Scale bar = 1mm for A-C; 275 μm for D-O.
Fig. 8
Fig. 8
Met transcript and protein expression in the septum in coronal sections from wild type and Emx1cre/Metfx/fx mice. A-C: In situ hybridization analysis of Met in wild type septum across perinatal (E18.5, A) and early postnatal development (P7, B; P14, C). At all ages, autoradiographic signal is observed specifically in dorsolateral and medial subnuclei. D-G: DIC photomicrographs of Met immunoreactivity from wild type mice show labeling throughout the septum (outlined regions) at P0 (D) and P7 (E), which is decreased by P14 (F) and hardly detectable above background levels at P16 (G). At P7, all Met staining of the dorsolateral septum (H) and partial staining of the nucleus of the diagonal band (I) of wild type mice is preserved in Emx1cre/Metfx/fx mice (L and M). Stained afferents in the medial and intermediate septal nuclei (I) and the anteromedial hypothalamus (K) of wild type mice are absent in Emx1cre/Metfx/fx mice (M and O) at P7, indicating a dorsal pallial rather than septal origin for these fibers. Septo-habenular axons do not express Met as evidenced by a lack of staining in the stria medullaris in both wild type (J) and Emx1cre/Metfx/fx (N) mice at P7. Scale bar = 1.35mm for A-C; 550 μm for D-O.
Fig. 9
Fig. 9
In situ hybridization analysis of Met in the rostro-caudal extent of the amygdala during development. Autoradiographic images of E18.5 coronal sections show signal in the posterior cortical amygdala (A), the lateral, basal, and medial amygdala (B), and the nucleus of the lateral olfactory tract at the most rostral extent of the structure (C). Signal is observed in these same amygdaloid nuclei at both P7 (D, E, and F) and P14 (G, H, and I). Scale bar = 925μm for all panels.
Fig. 10
Fig. 10
DIC photomicrographs illustrate Met immunohistochemistry in coronal sections through the caudo-rostral extent of the amygdala and stria terminalis (st) in wild type (A, B, C, D, E, F) and Emx1cre/Metfx/fx (A’, B’, C’, D’, E’, F’) mice at P7. Met-expressing neurons in the posterior cortical amygdala (A) project labeled axons anteriorly in the st (B). More anteriorly, Met-expressing axons from the basal and medial amygdala (MeA) join the vertical limb of the st, course over the internal capsule (C, upper panel D, and E), and terminate in the ipsilateral bed nucleus of the stria terminalis (BST) and the contralateral BST via decussation at the midline (dashed line) (F). In Emx1cre/Metfx/fx mice, Met staining persists in a subset of st axons that originate from the MeA (arrows in C’, D’, E’, and F’). Met staining is also present in the nucleus of the lateral olfactory tract in the rostral extent of the amygdala in both wild type and Emx1cre/Metfx/fx mice (lower panel D and D’). Scale bar = 550 μm for all panels.
Fig. 11
Fig. 11
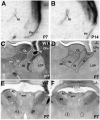
Met transcript and protein expression in the thalamus in coronal sections from wild type and Emx1cre/Metfx/fx mice. A and B: In situ hybridization analysis of Met in wild type thalamus at P7 (A) and P14 (B). Autoradiographic signal is detected specifically in the thalamic reticular nucleus (Rt) at these ages. DIC images of Met immunoreactivity at P7 show that neuropil staining in the Rt and dorsolateral and ventrolateral thalamic nuclei in wild type mice (C) is greatly reduced in corresponding regions of Emx1cre/Metfx/fx mice (D). Conversely, neuropil staining in specific anterior thalamic nuclei is equivalent in wild type (E) and Emx1cre/Metfx/fx (F) mice. Scale bar = 900μm for A,B; 550 μm for C, D, E, and F.
Fig. 12
Fig. 12
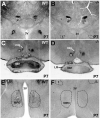
DIC photomicrographs illustrate Met immunoreactivity in coronal sections of the hypothalamus and associated axon tracts in wild type (A, C, and E) and Emx1cre/Metfx/fx (B, D, and F) mice at P7. Intense Met staining in the mammillothalamic and mammillotegmental tracts of wild type mice (A) is maintained at equivalent levels in Emx1cre/Metfx/fx mice (D). Notable Met staining on afferents within specific mammillary nuclei (C) and the medial preoptic nucleus (E) in wild type mice is absent in Emx1cre/Metfx/fx mice (D and F), indicating a dorsal pallial origin for these fibers. Scale bar = 550 μm for A, B, C, and D; 275 μm for E and F.
Fig. 13
Fig. 13
Met transcript and protein expression in the epithalamus in coronal sections from wild type and Emx1cre/Metfx/fx mice. A and B: In situ hybridization analysis of Met in wild type habenula at P7 and P14. Autoradiographic signal at both ages is specific to the medial but not the lateral habenula. DIC photomicrographs of Met immunoreactivity show equivalent, dense staining of axons in the habenular commissure and fasciculus retroflexus (fr) in wild type (C) and Emx1cre/Metfx/fx (D) mice at P7. Levels of axon staining also are equal within target areas of the fr, such as the interpeduncular nucleus, in wild type (E) and Emx1cre/Metfx/fx (F) mice at this age. Scale bar = 1.9mm for A,B; 275 μm for C, D, E and F.
Fig. 14
Fig. 14
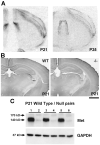
Analysis of Met transcript and protein expression in the developing mouse forebrain at P21 and P35. A: In situ hybridization analysis of Met in coronal sections from wild type mice at P21 and P35 shows equivalent patterns of expression to those observed in early postnatal development (P0 – P14). B: DIC photomicrographs of coronal sections from wild type (left) and Emx1cre/Metrx/fx (right) mice demonstrate that at P21 (shown here) and later, no differences in Met immunoreactivity are observed. C: Western blot analysis of total Met protein in P21 wild type and Emx1cre/Metfx/fx mice. Levels of Met in wild type mice (1,3,5) remain much higher than those in null mice (2,4,6) despite a lack of immunohistochemical staining as shown in B. Scale bar = 1.3 mm for both panels in A; 1.1 mm for both panels in B.

Similar articles

Cited by

References

    1. Aggleton JP. The amygdala : a functional analysis. xiv. Oxford University Press; Oxford, OX ; New York: 2000. p. 690.
    1. Aghajanian GK, Bloom FE. The formation of synaptic junctions in developing rat brain: a quantitative electron microscopic study. Brain Res. 1967;6:716–727. - PubMed
    1. Akagi K, Powell EW. Differential projections of habenular nuclei. J Comp Neurol. 1968;132:263–274. - PubMed
    1. Akimoto M, Baba A, Ikeda-Matsuo Y, Yamada MK, Itamura R, Nishiyama N, Ikegaya Y, Matsuki N. Hepatocyte growth factor as an enhancer of nmda currents and synaptic plasticity in the hippocampus. Neuroscience. 2004;128:155–162. - PubMed
    1. Allen GV, Hopkins DA. Mamillary body in the rat: topography and synaptology of projections from the subicular complex, prefrontal cortex, and midbrain tegmentum. J Comp Neurol. 1989;286:311–336. - PubMed

Publication types

MeSH terms

Substances