

Invasive prostate cancer cells are tumor initiating cells that have a stem cell-like genomic signature
- PMID: 19221883
- PMCID: PMC2782741
- DOI: 10.1007/s10585-009-9242-2
Invasive prostate cancer cells are tumor initiating cells that have a stem cell-like genomic signature
Abstract
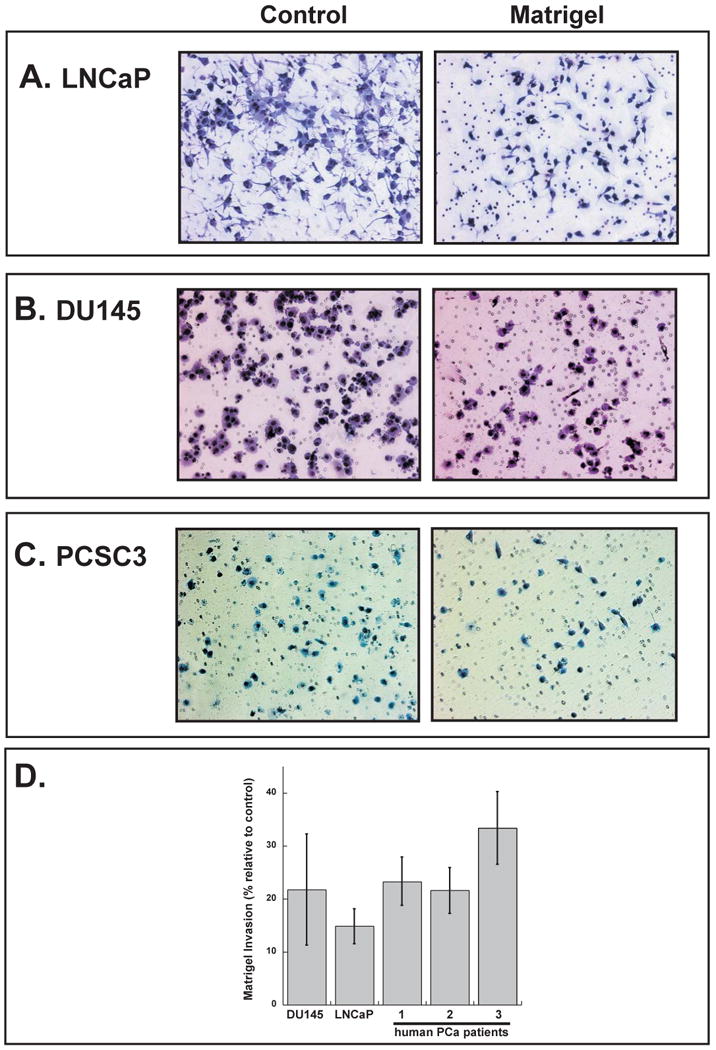
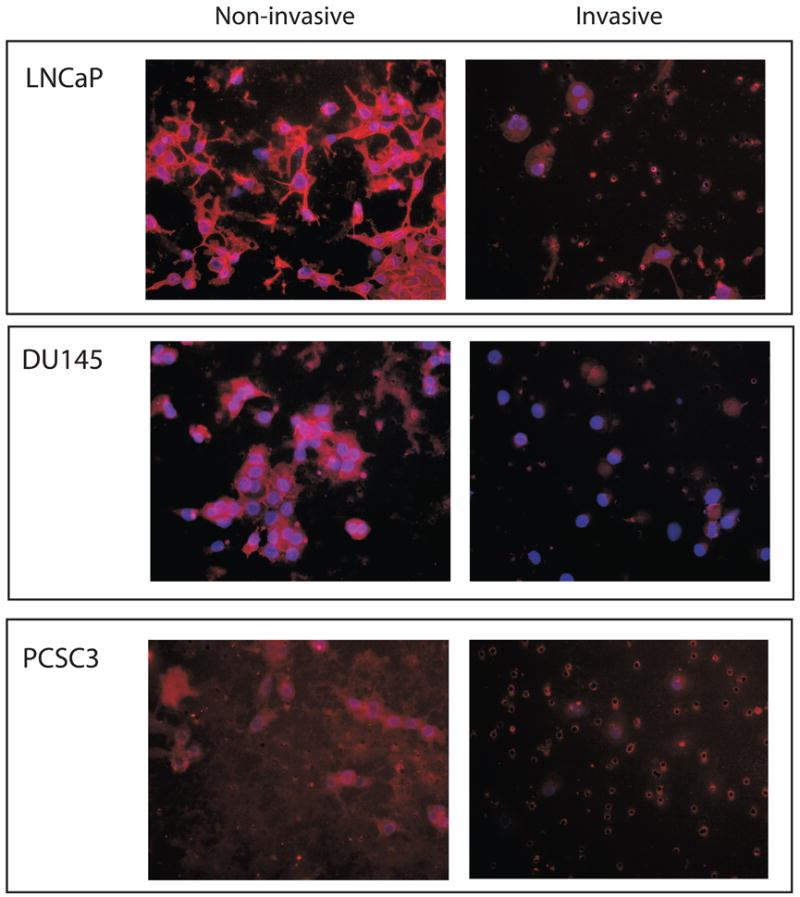
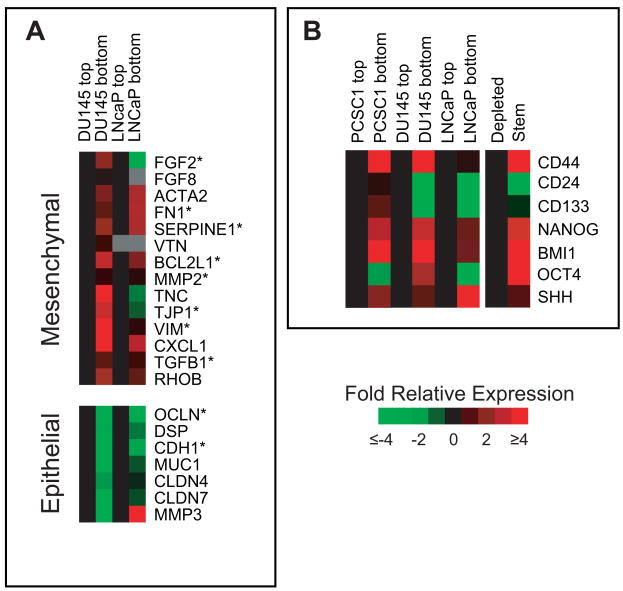
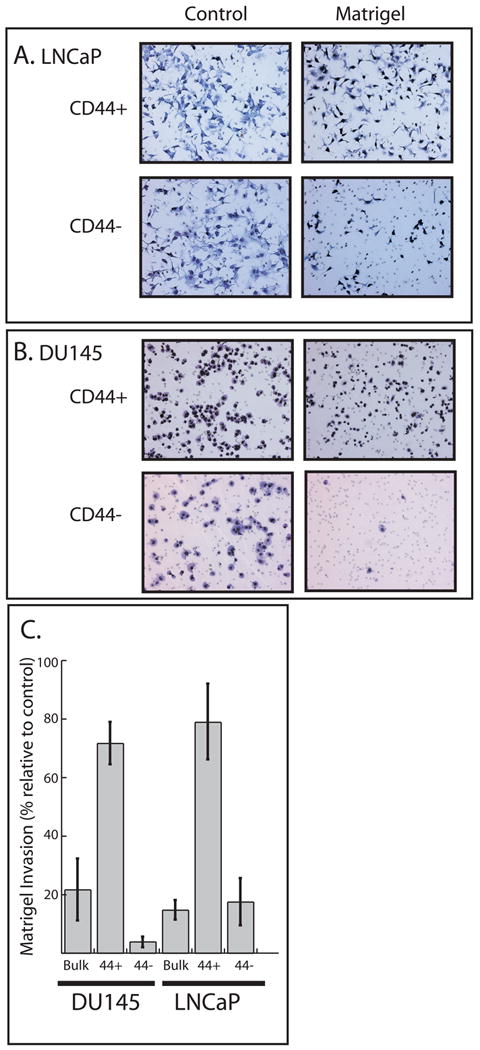
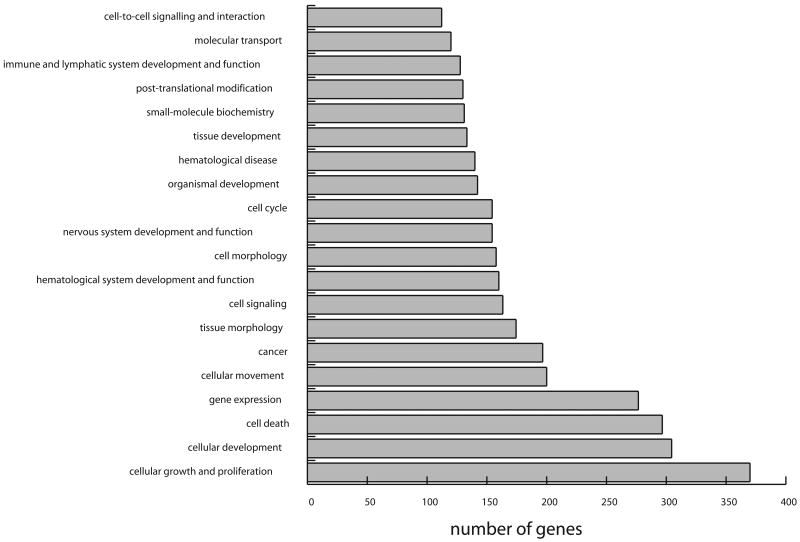
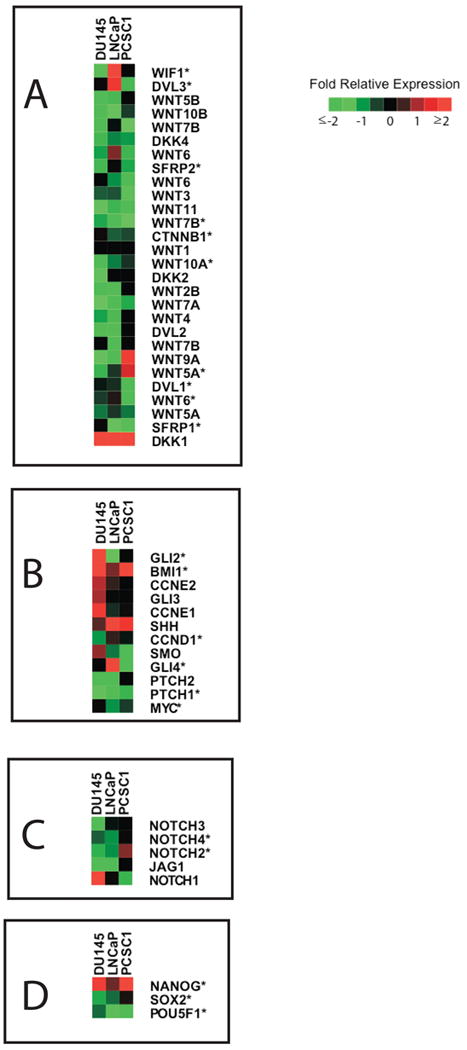
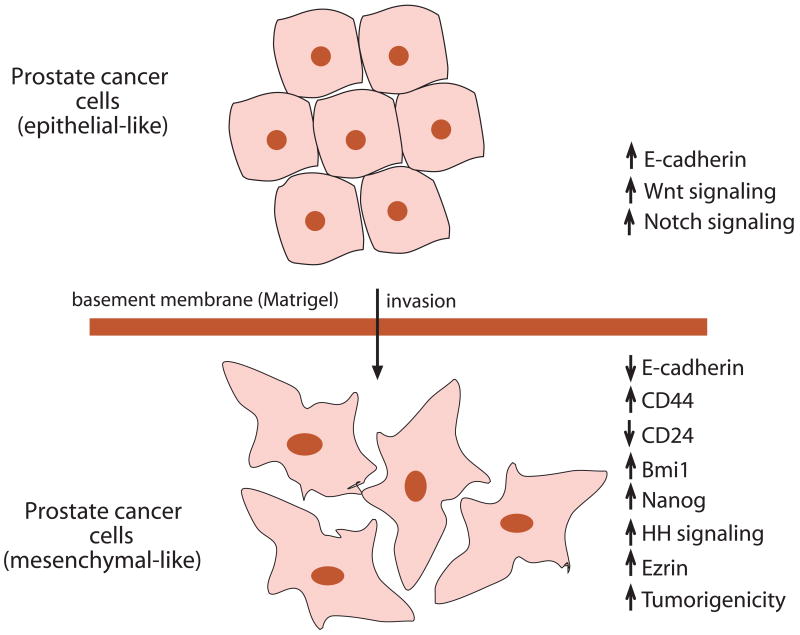
Development of metastasis is a leading cause of cancer-induced death. Acquisition of an invasive tumor cell phenotype suggests loss of cell adhesion and basement membrane breakdown during a process termed epithelial-to-mesenchymal transition (EMT). Recently, cancer stem cells (CSC) were discovered to mediate solid tumor initiation and progression. Prostate CSCs are a subpopulation of CD44(+) cells within the tumor that give rise to differentiated tumor cells and also self-renew. Using both primary and established prostate cancer cell lines, we tested the assumption that CSCs are more invasive. The ability of unsorted cells and CD44-positive and -negative subpopulations to undergo Matrigel invasion and EMT was evaluated, and the gene expression profiles of these cells were analyzed by microarray and a subset confirmed using QRT-PCR. Our data reveal that a subpopulation of CD44(+) CSC-like cells invade Matrigel through an EMT, while in contrast, CD44(-) cells are non-invasive. Furthermore, the genomic profile of the invasive cells closely resembles that of CD44(+)CD24(-) prostate CSCs and shows evidence for increased Hedgehog signaling. Finally, invasive cells from DU145 and primary prostate cancer cells are more tumorigenic in NOD/SCID mice compared with non-invasive cells. Our data strongly suggest that basement membrane invasion, an early and necessary step in metastasis development, is mediated by these potential cancer stem cells.
Figures
Similar articles
-
CD44+ CD24(-) prostate cells are early cancer progenitor/stem cells that provide a model for patients with poor prognosis.Br J Cancer. 2008 Feb 26;98(4):756-65. doi: 10.1038/sj.bjc.6604242. Epub 2008 Feb 12. Br J Cancer. 2008. PMID: 18268494 Free PMC article.
-
Cancer stem-like cells enriched with CD29 and CD44 markers exhibit molecular characteristics with epithelial-mesenchymal transition in squamous cell carcinoma.Arch Dermatol Res. 2013 Jan;305(1):35-47. doi: 10.1007/s00403-012-1260-2. Epub 2012 Jun 28. Arch Dermatol Res. 2013. PMID: 22740085
-
Cancer stem cells from colorectal cancer-derived cell lines.Proc Natl Acad Sci U S A. 2010 Feb 23;107(8):3722-7. doi: 10.1073/pnas.0915135107. Epub 2010 Feb 2. Proc Natl Acad Sci U S A. 2010. PMID: 20133591 Free PMC article.
-
Breast cancer stem cells and intrinsic subtypes: controversies rage on.Curr Stem Cell Res Ther. 2009 Jan;4(1):50-60. doi: 10.2174/157488809787169110. Curr Stem Cell Res Ther. 2009. PMID: 19149630 Review.
-
Frequent gene products and molecular pathways altered in prostate cancer- and metastasis-initiating cells and their progenies and novel promising multitargeted therapies.Mol Med. 2011 Sep-Oct;17(9-10):949-64. doi: 10.2119/molmed.2011.00115. Epub 2011 May 20. Mol Med. 2011. PMID: 21607288 Free PMC article. Review.
Cited by
-
The emerging role of histone lysine demethylases in prostate cancer.Mol Cancer. 2012 Aug 6;11:52. doi: 10.1186/1476-4598-11-52. Mol Cancer. 2012. PMID: 22867098 Free PMC article. Review.
-
Prediction of Biochemical Recurrence Based on Molecular Detection of Lymph Node Metastasis After Radical Prostatectomy.Eur Urol Open Sci. 2022 Aug 16;44:1-10. doi: 10.1016/j.euros.2022.07.005. eCollection 2022 Oct. Eur Urol Open Sci. 2022. PMID: 36185585 Free PMC article.
-
Cytotoxic effects induced by docetaxel, gefitinib, and cyclopamine on side population and nonside population cell fractions from human invasive prostate cancer cells.Mol Cancer Ther. 2010 Mar;9(3):617-30. doi: 10.1158/1535-7163.MCT-09-1013. Epub 2010 Feb 23. Mol Cancer Ther. 2010. PMID: 20179163 Free PMC article.
-
Cancer Stem Cells and Epithelial-to-Mesenchymal Transition (EMT)-Phenotypic Cells: Are They Cousins or Twins?Cancers (Basel). 2011 Feb 21;3(1):716-29. doi: 10.3390/cancers30100716. Cancers (Basel). 2011. PMID: 21643534 Free PMC article.
-
Prostate cancer stem cell-targeted efficacy of a new-generation taxoid, SBT-1214 and novel polyenolic zinc-binding curcuminoid, CMC2.24.PLoS One. 2013 Sep 24;8(9):e69884. doi: 10.1371/journal.pone.0069884. eCollection 2013. PLoS One. 2013. PMID: 24086245 Free PMC article.
References
-
- Fidler IJ. The pathogenesis of cancer metastasis: the ‘seed and soil’ hypothesis revisited. Nat Rev Cancer. 2003;3(6):453–8. - PubMed
-
- Molloy T, van 't Veer LJ. Recent advances in metastasis research. Curr Opin Genet Dev. 2008;18(1-7) - PubMed
-
- Steeg PS. Tumor metastasis: mechanistic insights and clinical challenges. Nat Med. 2006;12(8):895–904. - PubMed
-
- Hugo H, Ackland ML, Blick T, et al. Epithelial--mesenchymal and mesenchymal--epithelial transitions in carcinoma progression. J Cell Physiol. 2007;213(2):374–83. - PubMed
-
- Thiery JP. Epithelial-mesenchymal transitions in tumour progression. Nat Rev Cancer. 2002;2(6):442–54. - PubMed
Publication types
MeSH terms
Substances
Grants and funding
LinkOut - more resources
Full Text Sources
Medical
Miscellaneous
