One-dimensional topography underlies three-dimensional fibrillar cell migration
- PMID: 19221195
- PMCID: PMC2654121
- DOI: 10.1083/jcb.200810041
One-dimensional topography underlies three-dimensional fibrillar cell migration
Abstract
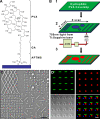
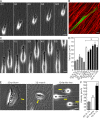
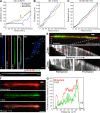
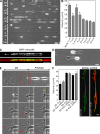
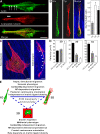
Current concepts of cell migration were established in regular two-dimensional (2D) cell culture, but the roles of topography are poorly understood for cells migrating in an oriented 3D fibrillar extracellular matrix (ECM). We use a novel micropatterning technique termed microphotopatterning (microPP) to identify functions for 1D fibrillar patterns in 3D cell migration. In striking contrast to 2D, cell migration in both 1D and 3D is rapid, uniaxial, independent of ECM ligand density, and dependent on myosin II contractility and microtubules (MTs). 1D and 3D migration are also characterized by an anterior MT bundle with a posterior centrosome. We propose that cells migrate rapidly through 3D fibrillar matrices by a 1D migratory mechanism not mimicked by 2D matrices.
Figures
Similar articles
-
Micro-environmental control of cell migration--myosin IIA is required for efficient migration in fibrillar environments through control of cell adhesion dynamics.J Cell Sci. 2012 May 1;125(Pt 9):2244-56. doi: 10.1242/jcs.098806. Epub 2012 Feb 10. J Cell Sci. 2012. PMID: 22328520 Free PMC article.
-
Local 3D matrix microenvironment regulates cell migration through spatiotemporal dynamics of contractility-dependent adhesions.Nat Commun. 2015 Nov 9;6:8720. doi: 10.1038/ncomms9720. Nat Commun. 2015. PMID: 26548801 Free PMC article.
-
Direct comparison of five different 3D extracellular matrix model systems for characterization of cancer cell migration.Cancer Rep (Hoboken). 2020 Oct;3(5):e1257. doi: 10.1002/cnr2.1257. Epub 2020 Jun 8. Cancer Rep (Hoboken). 2020. PMID: 33085847 Free PMC article.
-
Regulation of cell adhesion and migration by cell-derived matrices.Exp Cell Res. 2013 Oct 1;319(16):2434-9. doi: 10.1016/j.yexcr.2013.05.030. Epub 2013 Jun 7. Exp Cell Res. 2013. PMID: 23751565 Free PMC article. Review.
-
Dimensions and dynamics in integrin function.Braz J Med Biol Res. 2003 Aug;36(8):959-66. doi: 10.1590/s0100-879x2003000800001. Epub 2003 Jul 23. Braz J Med Biol Res. 2003. PMID: 12886449 Review.
Cited by
-
Fibrous Hydrogels for Cell Encapsulation: A Modular and Supramolecular Approach.PLoS One. 2016 May 25;11(5):e0155625. doi: 10.1371/journal.pone.0155625. eCollection 2016. PLoS One. 2016. PMID: 27223105 Free PMC article.
-
Directing cell migration and organization via nanocrater-patterned cell-repellent interfaces.Nat Mater. 2015 Sep;14(9):918-23. doi: 10.1038/nmat4342. Epub 2015 Jul 27. Nat Mater. 2015. PMID: 26213899 Free PMC article.
-
Computational modeling of single-cell migration: the leading role of extracellular matrix fibers.Biophys J. 2012 Sep 19;103(6):1141-51. doi: 10.1016/j.bpj.2012.07.048. Biophys J. 2012. PMID: 22995486 Free PMC article.
-
Group choreography: mechanisms orchestrating the collective movement of border cells.Nat Rev Mol Cell Biol. 2012 Oct;13(10):631-45. doi: 10.1038/nrm3433. Nat Rev Mol Cell Biol. 2012. PMID: 23000794 Free PMC article. Review.
-
Tuning Structural Organization via Molecular Design and Hierarchical Assembly to Develop Supramolecular Thermoresponsive Hydrogels.Macromolecules. 2024 Jul 3;57(14):6606-6615. doi: 10.1021/acs.macromol.4c00567. eCollection 2024 Jul 23. Macromolecules. 2024. PMID: 39071041 Free PMC article.
References
Publication types
MeSH terms
Substances
Grants and funding
LinkOut - more resources
Full Text Sources
Other Literature Sources

