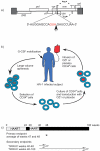
Phase 2 gene therapy trial of an anti-HIV ribozyme in autologous CD34+ cells
- PMID: 19219022
- PMCID: PMC2768566
- DOI: 10.1038/nm.1932
Phase 2 gene therapy trial of an anti-HIV ribozyme in autologous CD34+ cells
Abstract
Gene transfer has potential as a once-only treatment that reduces viral load, preserves the immune system and avoids lifetime highly active antiretroviral therapy. This study, which is to our knowledge the first randomized, double-blind, placebo-controlled, phase 2 cell-delivered gene transfer clinical trial, was conducted in 74 HIV-1-infected adults who received a tat-vpr-specific anti-HIV ribozyme (OZ1) or placebo delivered in autologous CD34+ hematopoietic progenitor cells. There were no OZ1-related adverse events. There was no statistically significant difference in viral load between the OZ1 and placebo group at the primary end point (average at weeks 47 and 48), but time-weighted areas under the curve from weeks 40-48 and 40-100 were significantly lower in the OZ1 group. Throughout the 100 weeks, CD4+ lymphocyte counts were higher in the OZ1 group. This study indicates that cell-delivered gene transfer is safe and biologically active in individuals with HIV and can be developed as a conventional therapeutic product.
Trial registration: ClinicalTrials.gov NCT00074997.
Figures


Similar articles
-
Mathematical modelling of the impact of haematopoietic stem cell-delivered gene therapy for HIV.J Gene Med. 2009 Dec;11(12):1077-86. doi: 10.1002/jgm.1401. J Gene Med. 2009. PMID: 19777528
-
RNA-based anti-HIV-1 gene therapeutic constructs in SCID-hu mouse model.Mol Ther. 2002 Dec;6(6):770-82. doi: 10.1006/mthe.2002.0800. Mol Ther. 2002. PMID: 12498773
-
Dendritic Cell Immunotherapy for HIV-1 Infection Using Autologous HIV-1 RNA: A Randomized, Double-Blind, Placebo-Controlled Clinical Trial.J Acquir Immune Defic Syndr. 2016 May 1;72(1):31-8. doi: 10.1097/QAI.0000000000000926. J Acquir Immune Defic Syndr. 2016. PMID: 26751016 Free PMC article. Clinical Trial.
-
Technology evaluation: HIV ribozyme gene therapy, Gene Shears Pty Ltd.Curr Opin Mol Ther. 2000 Jun;2(3):332-5. Curr Opin Mol Ther. 2000. PMID: 11249628 Review.
-
siRNAs, ribozymes and RNA decoys in modeling stem cell-based gene therapy for HIV/AIDS.Anticancer Res. 2003 May-Jun;23(3A):1997-2005. Anticancer Res. 2003. PMID: 12894572 Review.
Cited by
-
The clonal repopulation of HSPC gene modified with anti-HIV-1 RNAi is not affected by preexisting HIV-1 infection.Sci Adv. 2020 Jul 22;6(30):eaay9206. doi: 10.1126/sciadv.aay9206. eCollection 2020 Jul. Sci Adv. 2020. PMID: 32766447 Free PMC article.
-
Stem cell-based therapies for HIV/AIDS.Adv Drug Deliv Rev. 2016 Aug 1;103:187-201. doi: 10.1016/j.addr.2016.04.027. Epub 2016 May 2. Adv Drug Deliv Rev. 2016. PMID: 27151309 Free PMC article. Review.
-
In vivo suppression of HIV by antigen specific T cells derived from engineered hematopoietic stem cells.PLoS Pathog. 2012;8(4):e1002649. doi: 10.1371/journal.ppat.1002649. Epub 2012 Apr 12. PLoS Pathog. 2012. PMID: 22511873 Free PMC article. Clinical Trial.
-
MNAzymes, a versatile new class of nucleic acid enzymes that can function as biosensors and molecular switches.J Am Chem Soc. 2010 Jan 27;132(3):1051-9. doi: 10.1021/ja9076777. J Am Chem Soc. 2010. PMID: 20038095 Free PMC article.
-
Analysis and comparison of electrical pulse parameters for gene electrotransfer of two different cell lines.J Membr Biol. 2010 Jul;236(1):97-105. doi: 10.1007/s00232-010-9282-1. Epub 2010 Jul 20. J Membr Biol. 2010. PMID: 20645081
References
-
- Baltimore D. Gene therapy. Intracellular immunization. Nature. 1988;335:395–396. - PubMed
-
- Amado RG, et al. Anti-human immunodeficiency virus hematopoietic progenitor cell-delivered ribozyme in a phase I study: myeloid and lymphoid reconstitution in human immunodeficiency virus type-1-infected patients. Hum Gene Ther. 2004;15:251–62. - PubMed
Publication types
MeSH terms
Substances
Associated data
Grants and funding
LinkOut - more resources
Full Text Sources
Other Literature Sources
Medical
Research Materials

