The dynamic control of kiss-and-run and vesicular reuse probed with single nanoparticles
- PMID: 19213879
- PMCID: PMC2696197
- DOI: 10.1126/science.1167373
The dynamic control of kiss-and-run and vesicular reuse probed with single nanoparticles
Abstract
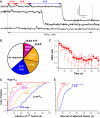
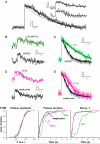
Vesicular secretion of neurotransmitter is essential for neuronal communication. Kiss-and-run is a mode of membrane fusion and retrieval without the full collapse of the vesicle into the plasma membrane and de novo regeneration. The importance of kiss-and-run during efficient neurotransmission has remained in doubt. We developed an approach for loading individual synaptic vesicles with single quantum dots. Their size and pH-dependent photoluminescence change allowed us to distinguish kiss-and-run from full-collapse fusion and to track single vesicles through multiple rounds of kiss-and-run and reuse, without perturbing vesicle cycling. Kiss-and-run dominated at the beginning of stimulus trains, reflecting the preference of vesicles with high release probability. Its incidence was increased by rapid firing, a response appropriate to shape the kinetics of neurotransmission during a wide range of firing patterns.
Figures


Comment in
-
Comment on "The dynamic control of kiss-and-run and vesicular reuse probed with single nanoparticles".Science. 2009 Sep 18;325(5947):1499; author reply 1499. doi: 10.1126/science.1175790. Science. 2009. PMID: 19762627
Similar articles
-
Comment on "The dynamic control of kiss-and-run and vesicular reuse probed with single nanoparticles".Science. 2009 Sep 18;325(5947):1499; author reply 1499. doi: 10.1126/science.1175790. Science. 2009. PMID: 19762627
-
Real-time three-dimensional tracking of single synaptic vesicles reveals that synaptic vesicles undergoing kiss-and-run fusion remain close to their original fusion site before reuse.Biochem Biophys Res Commun. 2019 Jun 30;514(3):1004-1008. doi: 10.1016/j.bbrc.2019.05.043. Epub 2019 May 12. Biochem Biophys Res Commun. 2019. PMID: 31092326
-
Influence of synaptic vesicle position on release probability and exocytotic fusion mode.Science. 2012 Mar 16;335(6074):1362-6. doi: 10.1126/science.1216937. Epub 2012 Feb 16. Science. 2012. PMID: 22345401 Free PMC article.
-
Synaptic vesicle endocytosis: fast and slow modes of membrane retrieval.Trends Neurosci. 2008 Nov;31(11):559-68. doi: 10.1016/j.tins.2008.08.005. Epub 2008 Sep 24. Trends Neurosci. 2008. PMID: 18817990 Free PMC article. Review.
-
Kiss-and-run and full-collapse fusion as modes of exo-endocytosis in neurosecretion.J Neurochem. 2006 Jun;97(6):1546-70. doi: 10.1111/j.1471-4159.2006.03987.x. J Neurochem. 2006. PMID: 16805768 Review.
Cited by
-
Protein mutated in paroxysmal dyskinesia interacts with the active zone protein RIM and suppresses synaptic vesicle exocytosis.Proc Natl Acad Sci U S A. 2015 Mar 10;112(10):2935-41. doi: 10.1073/pnas.1501364112. Epub 2015 Feb 17. Proc Natl Acad Sci U S A. 2015. PMID: 25730884 Free PMC article.
-
Methods of measuring presynaptic function with fluorescence probes.Appl Microsc. 2021 Mar 17;51(1):2. doi: 10.1186/s42649-021-00051-0. Appl Microsc. 2021. PMID: 33730244 Free PMC article. Review.
-
SNARE proteins synaptobrevin, SNAP-25, and syntaxin are involved in rapid and slow endocytosis at synapses.Cell Rep. 2013 May 30;3(5):1414-21. doi: 10.1016/j.celrep.2013.03.010. Epub 2013 May 2. Cell Rep. 2013. PMID: 23643538 Free PMC article.
-
Advances in imaging ultrastructure yield new insights into presynaptic biology.Front Cell Neurosci. 2015 May 22;9:196. doi: 10.3389/fncel.2015.00196. eCollection 2015. Front Cell Neurosci. 2015. PMID: 26052269 Free PMC article. Review.
-
Single Quantum Dot Tracking Illuminates Neuroscience at the Nanoscale.Chem Phys Lett. 2018 Aug 16;706:741-752. doi: 10.1016/j.cplett.2018.06.019. Epub 2018 Jun 19. Chem Phys Lett. 2018. PMID: 30270931 Free PMC article.
References
Publication types
MeSH terms
Substances
Grants and funding
LinkOut - more resources
Full Text Sources
Other Literature Sources

