. 2009 Apr 24;284(17):11622-36.
doi: 10.1074/jbc.M805940200. Epub 2009 Feb 11.

The Toca-1-N-WASP complex links filopodial formation to endocytosis

Affiliations

The Toca-1-N-WASP complex links filopodial formation to endocytosis

Wenyu Bu et al. J Biol Chem. .

Abstract

The transducer of Cdc42-dependent actin assembly (Toca-1)-N-WASP complex was isolated as an essential cofactor for Cdc42-driven actin polymerization in vitro. Toca-1 consists of an N-terminal F-BAR domain, followed by a Cdc42 binding site (HR1 domain) and an SH3 domain, (the N-WASP interacting site). N-WASP is an activator of actin nucleation through the Arp2/3 complex. The aim of the present study was to investigate the cellular function of the Toca-1-N-WASP complex. We report that Toca-1 induces filopodia and neurites as does N-WASP in N1E115 neuroblastoma cells. Toca-1 requires the F-BAR domain, Cdc42 binding site, and SH3 domain to induce filopodia. Toca-1 and N-WASP both require each other to induce filopodia. The expression of Toca-1 and N-WASP affects the distribution, size, and number of Rab5 positive membranes. Toca-1 interacts directly with N-WASP in filopodia and Rab5 membrane as seen by Forster resonance energy transfer. Thus the Toca-1-N-WASP complex localizes to and induces the formation of filopodia and endocytic vesicles. Last, three inhibitors of endocytosis, Dynamin-K44A, Eps15Delta95/295, and clathrin heavy chain RNA interference, block Toca-1-induced filopodial formation. Taken together, these data suggest that the Toca-1-N-WASP complex can link filopodial formation to endocytosis.


Figures

FIGURE 1.
FIGURE 1.
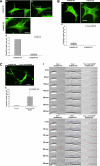
Toca-1 and N-WASP induce filopodia and neurites in N1E115 cells. A, N1E115 cells were transfected with GFP-actin, GFP-actin/Myc-Toca-1, or GFP-actin/Myc-Toca-1W518K and GFP-actin/HA-N-WASP. GFP fluorescence was monitored by confocal microscopy. The panels below the arrows show enlarged neurites to allow monitoring of complexity and filopodial formation. Bar = 50 μm. B, bar charts show statistical analysis (for at least three independent experiments, n = 15 cells). Cells were scored for neurites and filopodia as described under “Materials and Methods.” Data are presented as mean ± S.D. C, to measure filopodial characteristics we used DIC time-lapse microscopy. Individual filopodia were followed from appearance to disappearance and the time required defined as the lifetime. Length of filopodia is the maximum length as measured from the base to the tip under DIC. All these experiments include sequential GFP-actin imaging to ensure that the structures contain actin. To assess the characteristics of the Toca-1-induced filopodia we carried out DIC time-lapse experiments of transfected cells. The DIC image shows a typical neurite with associated Toca-1-induced filopodia over a time course as indicated in individual frames. Arrowheads (empty, white, and black) follow three independent filopodia over the time course. Bar = 4 μm.
FIGURE 2.
FIGURE 2.
Effect of mutations in Toca-1 on filopodial formation. A, a schematic of the domain structure of Toca-1 is shown with positions of the mutations used. Three distinct domain mutations were generated: F-BAR domain, HR1 domain (Cdc42 binding site), and SH3 domain (N-WASP interacting site). B, mutant Toca-1 genes were transfected into N1E115 cells as mRFP fusions with GFP-actin. The main panel shows three images: mRFP, GFP, and the merge with the different version of Toca-1 transfected. Three F-BAR domain mutants, K33Q/R35Q, K51Q/K52Q, and R112Q/K113 were used. The Cdc42 binding mutant was M383I/G384S/D385T. The SH3 domain mutant was W518K. C, bar charts show statistical analysis of the experiments. Three independent experiments were performed (with n = 15-20). Transfected cells were scored for neurite and filopodial formation. The data are presented as mean ± S.D. Bar = 10 μm. D, Toca-1 F-BAR domain and mutants were purified as glutathione S-transferase fusion proteins and lipid sedimentation assays carried out as described under “Materials and Methods.” S, supernatant; P, pellet. The data are presented as mean ± S.D. (n = 6) from two experiments. PI(4,5)P2, phosphatidylinositol 4,5-bisphosphate.
FIGURE 3.
FIGURE 3.
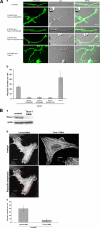
Toca-1 does not generate filopodia in N-WASP KO cells. A, Toca-1 was transfected into N-WASP WT (flox) and N-WASP KO cells (1h51) and filopodial number per cell was scored as described under “Materials and Methods.” Flox and 1h51 N-WASP KO cells were from Lommel et al. (51). Panels a and b, WT cells; panel c, N-WASP KO cells. Three independent experiments were performed (n = 20) and one representative example is shown. Data shown are mean ± S.D. Bar = 10 μm. B, Toca-1W518K was transfected into WT and N-WASP KO cells and morphology monitored. C, N-WASP KO cells were transfected with Toca-1 and N-WASP to allow reconstitution of the cells. The right panel shows a DIC time-lapse sequence (in seconds: 0, 50, 100, 150, 200, 250, and 300) of the three combinations. Toca-1 in N-WASP WT cells, Toca-1 in N-WASP KO cells, and Toca-1 with N-WASP and N-WASP KO cells. Tracings show structures generated: red, filopodia and blue, lamellipodia. In parts a-c, the bar charts show a statistical analysis of the experiments. Three independent experiments were performed (withn=15-20). Data shown are mean ± S.D. Bar= 10 μm.
FIGURE 4.
FIGURE 4.
N-WASP-induced filopodial formation requires and synergizes with Toca-1. A, N1E115 cells were transfected with N-WASP alone, N-WASP with Toca-1 mutants, and N-WASP with Toca-1 (a). All transfections were carried out with GFP-actin. Panels show GFP and DIC images with a merge. The bar chart shows a statistical analysis of the experiments (b). Neurites and filopodial formation were scored as described under “Materials and Methods.” Toca-1 F-BAR domain and Cdc42 binding mutants were as described in the legend to Fig. 2. Three independent experiments were performed (with n = 10-15). Data shown are mean ± S.D. Bar = 10 μm. B, Toca-1 was KD using RNAi and the affect of N-WASP on filopodial formation examined. a, Toca-1 protein levels with control RNAi and Toca-1 RNAi. b, left panel, N-WASP transfection with control RNAi. Right panel, N-WASP transfection with Toca-1 RNAi. Lower panel shows tracing of filopodia in red. c, statistical analysis of experiments similar to those presented in b of single cells. Data shown are mean ± S.D. (n = 20).
FIGURE 5.
FIGURE 5.
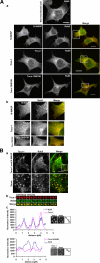
Localization of N-WASP and Toca-1 with Rab5. A, N1E115 cells were transfected with N-WASP, Toca-1, or Toca-1W518K and stained for Rab5 with anti-Rab5 antibody. Images follow the sequence, N-WASP or Toca-1 (green), Rab5 (red) and merge (a). Bar = 10 μm. Magnification of the images presented in A show potential co-localization and vesicle morphology (b). B, cells were transfected with Toca-1/N-WASP and then stained for Rab5. a, shows a series of three images of a typical cell (in the merge panel; red, Toca-1; green, Rab5). The lower set of image panels are enlarged (zoom) areas of the box in the merge panel. b, 12 randomly picked vesicles were placed in a grid pattern to allow direct side-by-side comparison and co-localization analysis. c, a group of Rab5 membrane from either Toca-1/N-WASP or Toca-1W518K transfection were analyzed for co-localization by intensity tracing through the vesicle. First two panels in c following intensity tracing are the actual vesicles that were examined. The schematic of the vesicles (third panel) shows the intensity line. Intensity analysis was carried out as described under “Materials and Methods.”
FIGURE 6.
FIGURE 6.
Localization of N-WASP and Toca-1 with actin. N1E115 cells were transfected with Toca-1 with GFP-actin, Toca-1 with N-WASP, or N-WASP with mRFP-actin, and filopodia and vesicles followed. Images are in a series of three: GFP, mRFP, and overlay. A, a, localization of Toca-1/actin; b, Toca-1/N-WASP; and c, N-WASP/actin in filopodia. B, GFP-actin/mRFP-Toca-1 expression in N1E115 cells. Lower panels of a are duplicates that have tracings showing the relationship between filopodia and Toca-1 localization. Toca-1 is found at the base of filopodia. Localization of Toca-1 with actin, at the leading edge (a) and in neurites (b) (the inset is an enlargement of the box area). c, intensity profile of two of the vesicles from b showing that Toca-1 and actin co-localize. Bar = 10 μm.
FIGURE 7.
FIGURE 7.
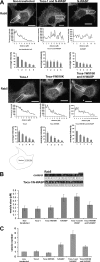
Effect of N-WASP and Toca-1 on the distribution, size, and number of Rab5 membrane. A, N1E115 cells were transfected with constructs, N-WASP, Toca-1/N-WASP, Toca-1, Toca-1W518K, and Toca-1W518K/N-WASP, and then cells were stained with Rab5 antibody. Intensity tracing below images follows the region of interest, open white arrow, from perinuclear area to the cell membrane, of the individual cell. Distribution of Rab5 membranes was determined by creating five zones (perinuclear to cell membrane) within the cell and counting the fluorescence intensity within each zone (details can be found under “Materials and Methods”). The bar charts show a statistical analysis of the intensity distributions in the five zones. A schematic of a cell showing the five zones used in the statistical analysis is shown at the bottom of the figure. Bar = 10 μm. Please note that the bar in the Toca-1/N-WASP transfection panel is smaller than the other panels. B, 14 randomly picked vesicular structures from either control or Toca-1/N-WASP-transfected cells were placed in a grid to allow side by side comparison. Vesicle size was determined by enlarging images so that the intensity boundary could be seen and then using Metamorph software to measure diameters. A schematic of the vesicle size is shown below the actual images to reflect the observed boundary. The bar chart shows statistical analysis of the vesicle size with different transfections. C, the bar chart shows a statistical analysis of vesicle number with different transfections. At least three independent experiments were carried out (with n = 20). Data shown are mean ± S.D. Bar = 2 μm.
FIGURE 8.
FIGURE 8.
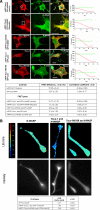
Toca-1 and N-WASP interact directly in filopodia and vesicles. A, N1E115 cells were transfected with mRFP-Toca-1 with GFP-N-WASP, or mRFP-Toca-1W518K with GFP-N-WASP, mRFP-Toca-1 with GFP-actin, and mRFP-Toca-1W518K with GFP-actin. FRET was measured by acceptor photobleaching as described under “Materials and Methods.” Images show a series of three panels: mRFP, GFP, and merge. Boxes within the image show areas where bleaching was carried out. Panels in the extreme right show signal intensity from GFP (green line) and mRFP (red line) channels, pre- and post-bleach, as a function of time. Table shows statistical analysis of the data generated in A. FRET efficiency and the Pearson correlation coefficient were calculated as described under “Materials and Methods.” Three independent experiments were performed and one representative example is shown. Data are presented as mean ± S.D. (n = 10). Bar = 10 μm. B, cells were generated as described above and GFP lifetime measurements were made using the frequency domain method (see “Material and Methods” and Clayton et al. (24)). GFP lifetimes were determined using Lambert Instruments (Netherlands) software. Images were acquired sequentially over a period of 4-5 s through 12 phase settings. Data are presented as a mean ± S.D. (n = 10).
FIGURE 9.
FIGURE 9.
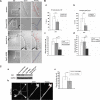
Effect of inhibitors of endocytosis on filopodial formation. A, N1E115 cells were transfected with Toca-1, GFP, or mRFP-actin, and either Eps15 (inactive variant or dominant negative) or Dynamin (wild-type or dominant negative). Cells were then imaged in the GFP and DIC channels. Imaging was carried out using Olympus FV1000 confocal microscope. B, endocytosis and filopodial formation were measured as described under “Materials and Methods.” Bar charts (a and b) show transferrin (TF) uptake. Bar charts (c and d) show filopodial number per cell. Three independent experiments were carried out (with n = 10-15) and one representative example is presented. C, protein expression of CHC was analyzed by Western blotting of cell extracts obtained with or without RNAi (a) as described under “Materials and Methods.” b, Toca-1-mediated filopodial formation was measured in cells transfected with Toca-1, GFP-actin, and +/- RNAi (first panel). Second panel shows an enlargement of the neurite of the cell. Third panel shows a tracing with filopodia indicated in red. Statistical analysis of the experiment is presented as a bar chart in c. Three independent experiments were carried out (with n = 10-15) and one representative example is presented. Data are presented as mean ± S.D. Experimental data were analyzed by Student's t test. Difference was significant when p < 0.05 (* stands for p < 0.05; ** for p < 0.01; *** for p < 0.001). Bar = 10 μm.

Similar articles

Cited by

References

    1. Bray, D. (2001) Cell Movement, From Molecules to Motility, 2nd Ed., Garland Publishing, New York, NY
    1. Johnson, D. I., and Pringle, J. R. (1990) J. Cell Biol. 111 143-152 - PMC - PubMed
    1. Kozma, R., Ahmed, S., Best, A., and Lim, L. (1995) Mol. Cell. Biol. 15 1942-1952 - PMC - PubMed
    1. Nobes, C. D., and Hall, A. (1995) Cell 81 53-62 - PubMed
    1. Gupton, S. L., and Gertler, F. B. (2007) Sci. STKE 2007 re5. - PubMed

MeSH terms

Substances

LinkOut - more resources