

A reexamination of information theory-based methods for DNA-binding site identification
- PMID: 19210776
- PMCID: PMC2680408
- DOI: 10.1186/1471-2105-10-57
A reexamination of information theory-based methods for DNA-binding site identification
Abstract
Background: Searching for transcription factor binding sites in genome sequences is still an open problem in bioinformatics. Despite substantial progress, search methods based on information theory remain a standard in the field, even though the full validity of their underlying assumptions has only been tested in artificial settings. Here we use newly available data on transcription factors from different bacterial genomes to make a more thorough assessment of information theory-based search methods.
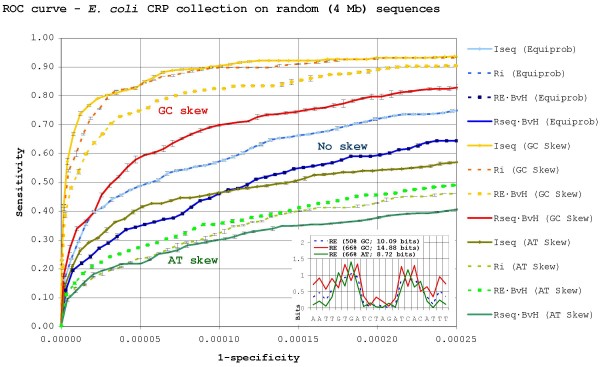
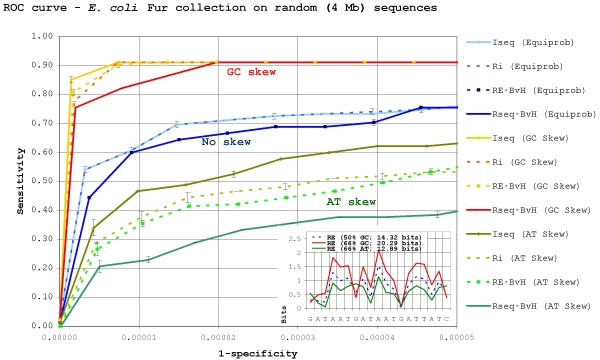
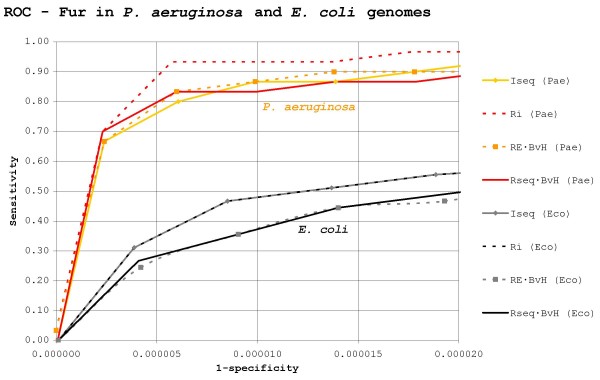
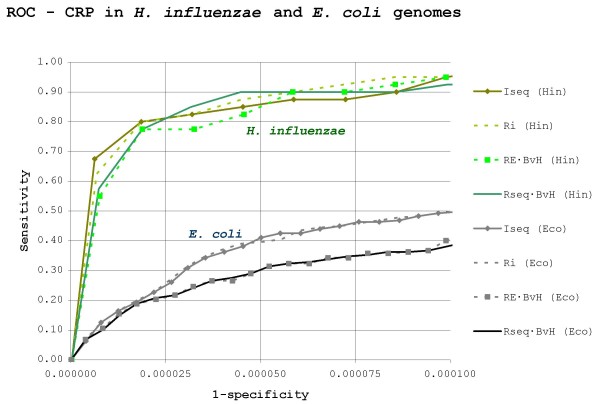
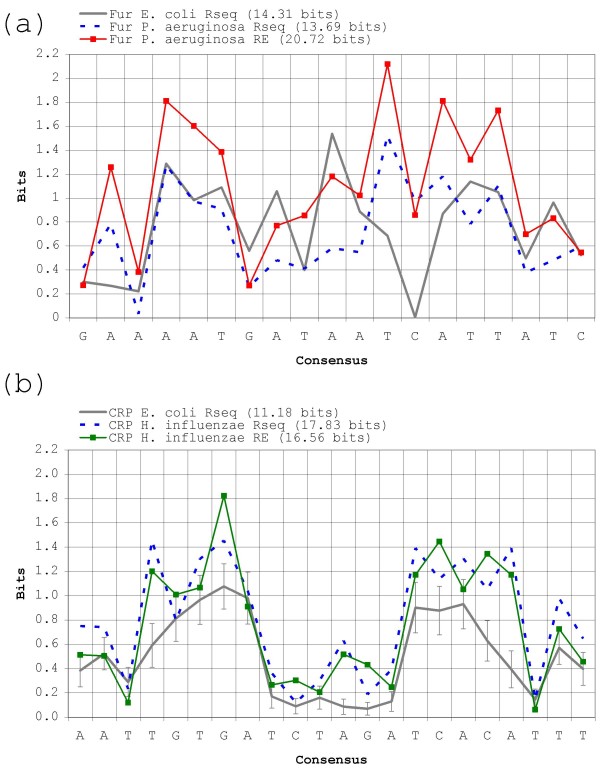
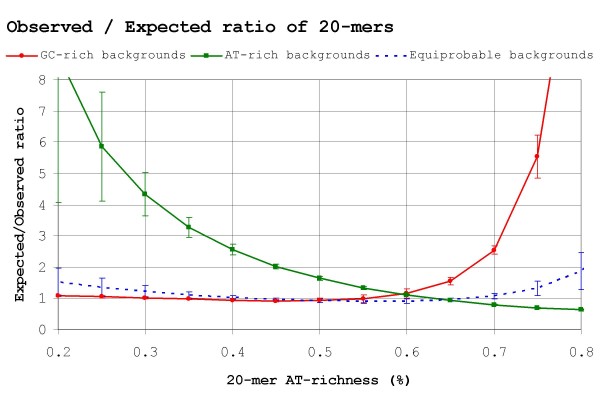
Results: Our results reveal that conventional benchmarking against artificial sequence data leads frequently to overestimation of search efficiency. In addition, we find that sequence information by itself is often inadequate and therefore must be complemented by other cues, such as curvature, in real genomes. Furthermore, results on skewed genomes show that methods integrating skew information, such as Relative Entropy, are not effective because their assumptions may not hold in real genomes. The evidence suggests that binding sites tend to evolve towards genomic skew, rather than against it, and to maintain their information content through increased conservation. Based on these results, we identify several misconceptions on information theory as applied to binding sites, such as negative entropy, and we propose a revised paradigm to explain the observed results.
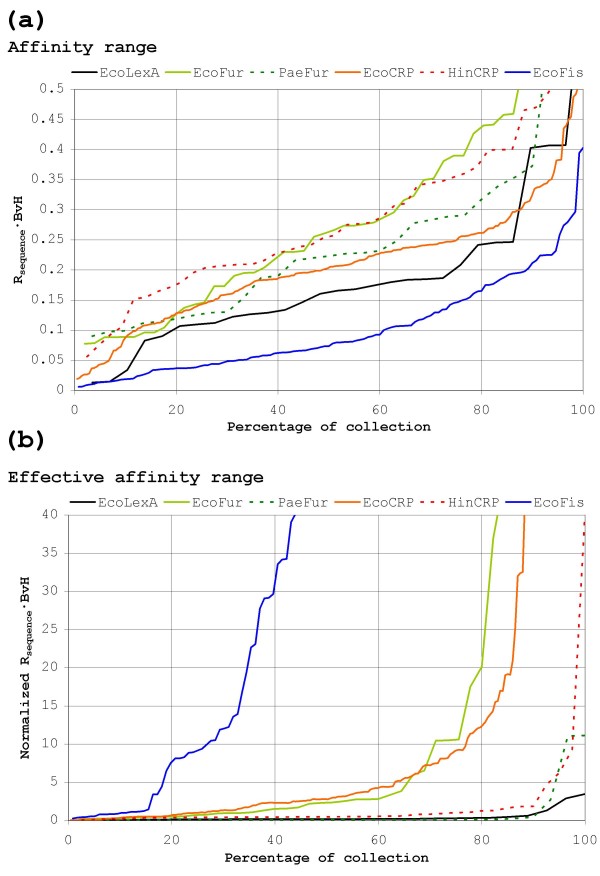
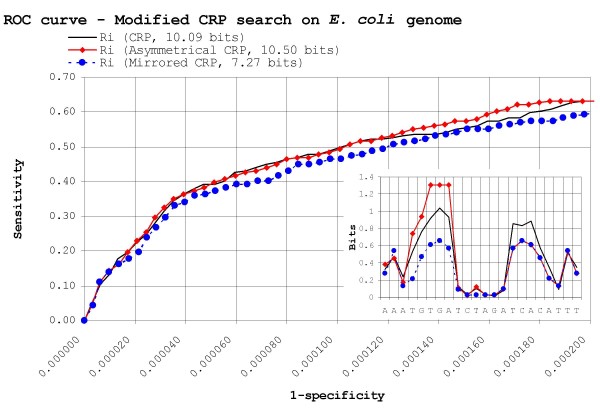
Conclusion: We conclude that, among information theory-based methods, the most unassuming search methods perform, on average, better than any other alternatives, since heuristic corrections to these methods are prone to fail when working on real data. A reexamination of information content in binding sites reveals that information content is a compound measure of search and binding affinity requirements, a fact that has important repercussions for our understanding of binding site evolution.
Figures

Similar articles
-
Information theory applications for biological sequence analysis.Brief Bioinform. 2014 May;15(3):376-89. doi: 10.1093/bib/bbt068. Epub 2013 Sep 20. Brief Bioinform. 2014. PMID: 24058049 Free PMC article. Review.
-
Transcription factor site dependencies in human, mouse and rat genomes.BMC Bioinformatics. 2009 Oct 16;10:339. doi: 10.1186/1471-2105-10-339. BMC Bioinformatics. 2009. PMID: 19835596 Free PMC article.
-
Comparative analysis of methods for representing and searching for transcription factor binding sites.Bioinformatics. 2004 Dec 12;20(18):3516-25. doi: 10.1093/bioinformatics/bth438. Epub 2004 Aug 5. Bioinformatics. 2004. PMID: 15297295
-
MAPPER: a search engine for the computational identification of putative transcription factor binding sites in multiple genomes.BMC Bioinformatics. 2005 Mar 30;6:79. doi: 10.1186/1471-2105-6-79. BMC Bioinformatics. 2005. PMID: 15799782 Free PMC article.
-
Structure-based ab initio prediction of transcription factor-binding sites.Methods Mol Biol. 2009;541:23-41. doi: 10.1007/978-1-59745-243-4_2. Methods Mol Biol. 2009. PMID: 19381536 Review.
Cited by
-
Flexible comparative genomics of prokaryotic transcriptional regulatory networks.BMC Genomics. 2020 Dec 16;21(Suppl 5):466. doi: 10.1186/s12864-020-06838-x. BMC Genomics. 2020. PMID: 33327941 Free PMC article.
-
Every Site Counts: Submitting Transcription Factor-Binding Site Information through the CollecTF Portal.J Bacteriol. 2015 Aug 1;197(15):2454-7. doi: 10.1128/JB.00031-15. Epub 2015 May 26. J Bacteriol. 2015. PMID: 26013488 Free PMC article.
-
BioWord: a sequence manipulation suite for Microsoft Word.BMC Bioinformatics. 2012 Jun 7;13:124. doi: 10.1186/1471-2105-13-124. BMC Bioinformatics. 2012. PMID: 22676326 Free PMC article.
-
Inference of self-regulated transcriptional networks by comparative genomics.Evol Bioinform Online. 2012;8:449-61. doi: 10.4137/EBO.S9205. Epub 2012 Aug 6. Evol Bioinform Online. 2012. PMID: 23032607 Free PMC article.
-
Information theory applications for biological sequence analysis.Brief Bioinform. 2014 May;15(3):376-89. doi: 10.1093/bib/bbt068. Epub 2013 Sep 20. Brief Bioinform. 2014. PMID: 24058049 Free PMC article. Review.
References
-
- Aparicio O, Geisberg JV, Struhl K. Chromatin immunoprecipitation for determining the association of proteins with specific genomic sequences in vivo. Current protocols in cell biology/editorial board, Juan S Bonifacino [et al] 2004;Chapter 17:Unit 17.17. - PubMed
-
- Robertson G, Hirst M, Bainbridge M, Bilenky M, Zhao Y, Zeng T, Euskirchen G, Bernier B, Varhol R, Delaney A, et al. Genome-wide profiles of STAT1 DNA association using chromatin immunoprecipitation and massively parallel sequencing. Nat Methods. 2007;4:651–657. - PubMed
-
- Bailey TL, Elkan C. Fitting a mixture model by expectation maximization to discover motifs in biopolymers. Proc Int Conf on Intell Syst Mol Biol. 1994;2:28–36. - PubMed
-
- Lawrence CE, Altschul SF, Boguski MS, Liu JS, Neuwald AF, Wootton JC. Detecting subtle sequence signals: a Gibbs sampling strategy for multiple alignment. Science. 1993;262:208–214. - PubMed
Publication types
MeSH terms
Substances
LinkOut - more resources
Full Text Sources
