

Phospholipase C-mediated hydrolysis of PIP2 releases ERM proteins from lymphocyte membrane
- PMID: 19204146
- PMCID: PMC2646552
- DOI: 10.1083/jcb.200807047
Phospholipase C-mediated hydrolysis of PIP2 releases ERM proteins from lymphocyte membrane
Abstract
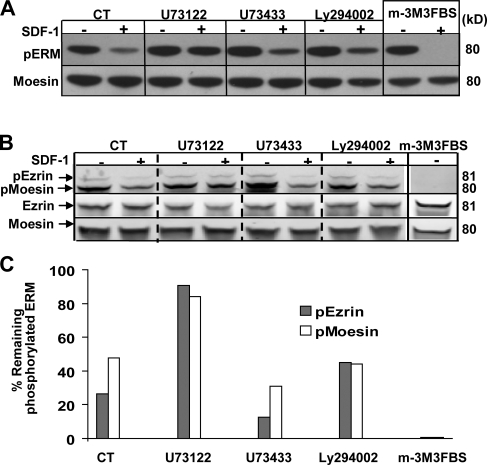
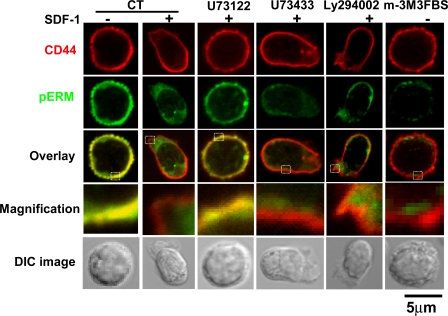
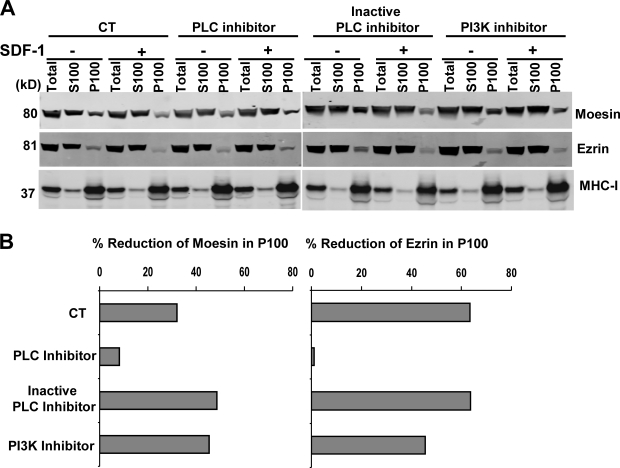
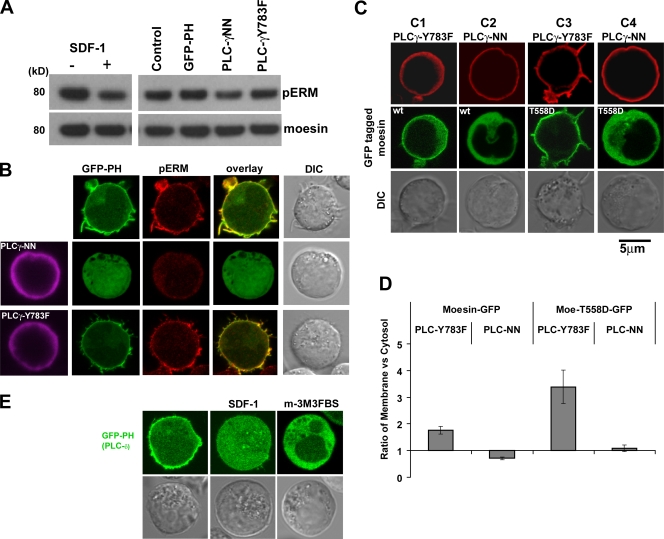
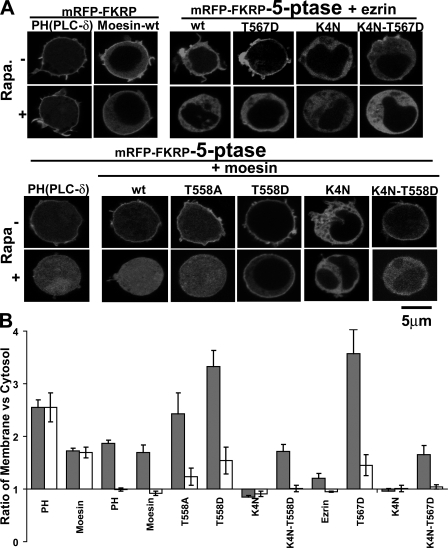
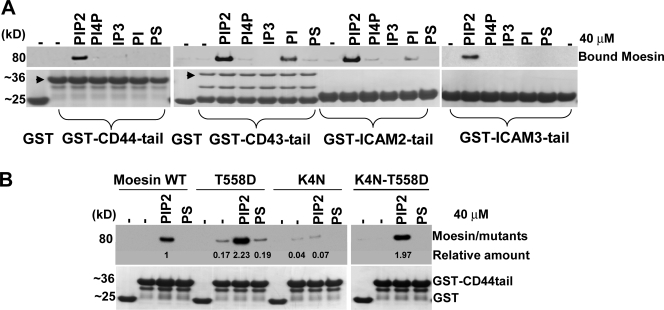
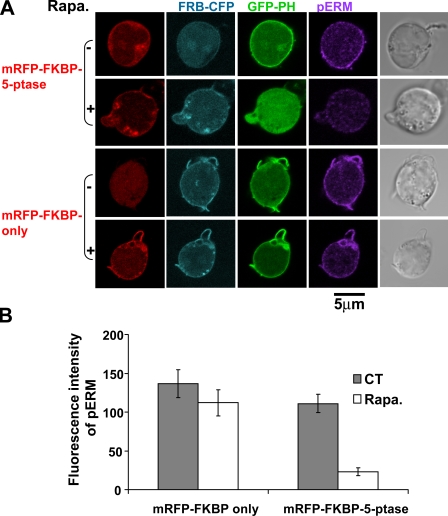
Mechanisms controlling the disassembly of ezrin/radixin/moesin (ERM) proteins, which link the cytoskeleton to the plasma membrane, are incompletely understood. In lymphocytes, chemokine (e.g., SDF-1) stimulation inactivates ERM proteins, causing their release from the plasma membrane and dephosphorylation. SDF-1-mediated inactivation of ERM proteins is blocked by phospholipase C (PLC) inhibitors. Conversely, reduction of phosphatidylinositol 4,5-bisphosphate (PIP2) levels by activation of PLC, expression of active PLC mutants, or acute targeting of phosphoinositide 5-phosphatase to the plasma membrane promotes release and dephosphorylation of moesin and ezrin. Although expression of phosphomimetic moesin (T558D) or ezrin (T567D) mutants enhances membrane association, activation of PLC still relocalizes them to the cytosol. Similarly, in vitro binding of ERM proteins to the cytoplasmic tail of CD44 is also dependent on PIP2. These results demonstrate a new role of PLCs in rapid cytoskeletal remodeling and an additional key role of PIP2 in ERM protein biology, namely hydrolysis-mediated ERM inactivation.
Figures
Similar articles
-
Regulation mechanism of ERM (ezrin/radixin/moesin) protein/plasma membrane association: possible involvement of phosphatidylinositol turnover and Rho-dependent signaling pathway.J Cell Biol. 1996 Oct;135(1):37-51. doi: 10.1083/jcb.135.1.37. J Cell Biol. 1996. PMID: 8858161 Free PMC article.
-
Apical membrane segregation of phosphatidylinositol-4,5-bisphosphate influences parathyroid hormone 1 receptor compartmental signaling and localization via direct regulation of ezrin in LLC-PK1 cells.Cell Signal. 2011 Oct;23(10):1659-68. doi: 10.1016/j.cellsig.2011.05.020. Epub 2011 Jun 7. Cell Signal. 2011. PMID: 21672629 Free PMC article.
-
Osmotic cell shrinkage activates ezrin/radixin/moesin (ERM) proteins: activation mechanisms and physiological implications.Am J Physiol Cell Physiol. 2008 Jan;294(1):C197-212. doi: 10.1152/ajpcell.00268.2007. Epub 2007 Oct 31. Am J Physiol Cell Physiol. 2008. PMID: 17977945
-
Cortical actin organization: lessons from ERM (ezrin/radixin/moesin) proteins.J Biol Chem. 1999 Dec 3;274(49):34507-10. doi: 10.1074/jbc.274.49.34507. J Biol Chem. 1999. PMID: 10574907 Review. No abstract available.
-
Re-defining ERM function in lymphocyte activation and migration.Immunol Rev. 2013 Nov;256(1):63-79. doi: 10.1111/imr.12104. Immunol Rev. 2013. PMID: 24117813 Review.
Cited by
-
The ezrin-radixin-moesin family of proteins in the regulation of B-cell immune response.Crit Rev Immunol. 2015;35(1):15-31. doi: 10.1615/critrevimmunol.2015012327. Crit Rev Immunol. 2015. PMID: 25746045 Free PMC article. Review.
-
Tailor-made ezrin actin binding domain to probe its interaction with actin in-vitro.PLoS One. 2015 Apr 10;10(4):e0123428. doi: 10.1371/journal.pone.0123428. eCollection 2015. PLoS One. 2015. PMID: 25860910 Free PMC article.
-
Characterization of an arachidonic acid-deficient (Fads1 knockout) mouse model.J Lipid Res. 2012 Jul;53(7):1287-95. doi: 10.1194/jlr.M024216. Epub 2012 Apr 25. J Lipid Res. 2012. PMID: 22534642 Free PMC article.
-
Dynamic regulation of CD45 lateral mobility by the spectrin-ankyrin cytoskeleton of T cells.J Biol Chem. 2010 Apr 9;285(15):11392-401. doi: 10.1074/jbc.M109.075648. Epub 2010 Feb 17. J Biol Chem. 2010. PMID: 20164196 Free PMC article.
-
Two Sides of the Coin: Ezrin/Radixin/Moesin and Merlin Control Membrane Structure and Contact Inhibition.Int J Mol Sci. 2019 Apr 23;20(8):1996. doi: 10.3390/ijms20081996. Int J Mol Sci. 2019. PMID: 31018575 Free PMC article. Review.
References
-
- Bacon K.B., Flores-Romo L., Life P.F., Taub D.D., Premack B.A., Arkinstall S.J., Wells T.N., Schall T.J., Power C.A. 1995. IL-8-induced signal transduction in T lymphocytes involves receptor-mediated activation of phospholipases C and D.J. Immunol. 154:3654–3666 - PubMed
-
- Balla T. 2005. Inositol-lipid binding motifs: signal integrators through protein-lipid and protein-protein interactions.J. Cell Sci. 118:2093–2104 - PubMed
-
- Bretscher A., Edwards K., Fehon R.G. 2002. ERM proteins and merlin: integrators at the cell cortex.Nat. Rev. Mol. Cell Biol. 3:586–599 - PubMed
Publication types
MeSH terms
Substances
Grants and funding
LinkOut - more resources
Full Text Sources
Other Literature Sources
Research Materials
Miscellaneous
