Circulating Ly-6C+ myeloid precursors migrate to the CNS and play a pathogenic role during autoimmune demyelinating disease
- PMID: 19196868
- PMCID: PMC2665891
- DOI: 10.1182/blood-2008-07-168575
Circulating Ly-6C+ myeloid precursors migrate to the CNS and play a pathogenic role during autoimmune demyelinating disease
Abstract
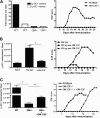
Mature myeloid cells (macrophages and CD11b(+) dendritic cells) form a prominent component of neuroinflammatory infiltrates in multiple sclerosis and experimental autoimmune encephalomyelitis (EAE). The mechanism by which these cells are replenished during relapsing and chronic neuroinflammation is poorly understood. Here we demonstrate that CD11b(+)CD62L(+)Ly6C(hi) monocytes with colony-forming potential are mobilized into the bloodstream by a granulocyte-macrophage colony-stimulating factor-dependent pathway immediately before EAE relapses. Circulating Ly6C(hi) monocytes traffic across the blood-brain barrier, up-regulate proinflammatory molecules, and differentiate into central nervous system dendritic cells and macrophages. Enrichment of Ly6C(hi) monocytes in the circulating pool is associated with an earlier onset and increased severity of clinical EAE. Our studies indicate that granulocyte-macrophage colony-stimulating factor-driven release of Ly6C(hi) precursors from the bone marrow prevents exhaustion of central nervous system myeloid populations during relapsing or chronic autoimmune demyelination, suggesting a novel pathway for therapeutic targeting.
Figures
Similar articles
-
Induction of inhibitory central nervous system-derived and stimulatory blood-derived dendritic cells suggests a dual role for granulocyte-macrophage colony-stimulating factor in central nervous system inflammation.Brain. 2010 Jun;133(Pt 6):1637-54. doi: 10.1093/brain/awq081. Epub 2010 Apr 27. Brain. 2010. PMID: 20424288
-
IL-1β enables CNS access to CCR2hi monocytes and the generation of pathogenic cells through GM-CSF released by CNS endothelial cells.Proc Natl Acad Sci U S A. 2018 Feb 6;115(6):E1194-E1203. doi: 10.1073/pnas.1714948115. Epub 2018 Jan 22. Proc Natl Acad Sci U S A. 2018. PMID: 29358392 Free PMC article.
-
CD11c(hi) Dendritic Cells Regulate Ly-6C(hi) Monocyte Differentiation to Preserve Immune-privileged CNS in Lethal Neuroinflammation.Sci Rep. 2015 Dec 2;5:17548. doi: 10.1038/srep17548. Sci Rep. 2015. PMID: 26626303 Free PMC article.
-
Monocytes and Monocyte-Derived Antigen-Presenting Cells Have Distinct Gene Signatures in Experimental Model of Multiple Sclerosis.Front Immunol. 2019 Nov 26;10:2779. doi: 10.3389/fimmu.2019.02779. eCollection 2019. Front Immunol. 2019. PMID: 31849962 Free PMC article.
-
The plasticity of inflammatory monocyte responses to the inflamed central nervous system.Cell Immunol. 2014 Sep-Oct;291(1-2):49-57. doi: 10.1016/j.cellimm.2014.07.002. Epub 2014 Jul 11. Cell Immunol. 2014. PMID: 25086710 Free PMC article. Review.
Cited by
-
Minireview: Emerging Concepts in Islet Macrophage Biology in Type 2 Diabetes.Mol Endocrinol. 2015 Jul;29(7):946-62. doi: 10.1210/me.2014-1393. Epub 2015 May 22. Mol Endocrinol. 2015. PMID: 26001058 Free PMC article. Review.
-
Role of microglia in CNS autoimmunity.Clin Dev Immunol. 2013;2013:208093. doi: 10.1155/2013/208093. Epub 2013 Jun 12. Clin Dev Immunol. 2013. PMID: 23840238 Free PMC article. Review.
-
Peripheral innate immune challenge exaggerated microglia activation, increased the number of inflammatory CNS macrophages, and prolonged social withdrawal in socially defeated mice.Psychoneuroendocrinology. 2012 Sep;37(9):1491-505. doi: 10.1016/j.psyneuen.2012.02.003. Epub 2012 Mar 2. Psychoneuroendocrinology. 2012. PMID: 22386198 Free PMC article.
-
Polarization of macrophages and microglia in inflammatory demyelination.Neurosci Bull. 2013 Apr;29(2):189-98. doi: 10.1007/s12264-013-1324-0. Epub 2013 Apr 5. Neurosci Bull. 2013. PMID: 23558588 Free PMC article. Review.
-
Nanomodulation of Macrophages in Multiple Sclerosis.Cells. 2019 Jun 5;8(6):543. doi: 10.3390/cells8060543. Cells. 2019. PMID: 31195710 Free PMC article. Review.
References
-
- Serafini B, Rosicarelli B, Magliozzi R, et al. Dendritic cells in multiple sclerosis lesions: maturation stage, myelin uptake, and interaction with proliferating T cells. J Neuropathol Exp Neurol. 2006;65:124–141. - PubMed
-
- Deshpande P, King IL, Segal BM. Cutting edge: CNS CD11c+ cells from mice with encephalomyelitis polarize Th17 cells and support CD25+CD4+ T cell-mediated immunosuppression, suggesting dual roles in the disease process. J Immunol. 2007;178:6695–6699. - PubMed
-
- Greter M, Heppner FL, Lemos MP, et al. Dendritic cells permit immune invasion of the CNS in an animal model of multiple sclerosis. Nat Med. 2005;11:328–334. - PubMed
-
- Segal BM. CNS chemokines, cytokines, and dendritic cells in autoimmune demyelination. J Neurol Sci. 2005;228:210–214. - PubMed
-
- McMahon EJ, Bailey SL, Castenada CV, Waldner H, Miller SD. Epitope spreading initiates in the CNS in two mouse models of multiple sclerosis. Nat Med. 2005;11:335–339. - PubMed
Publication types
MeSH terms
Substances
Grants and funding
LinkOut - more resources
Full Text Sources
Other Literature Sources
Molecular Biology Databases
Research Materials

