. 2009 Apr;29(8):2193-204.
doi: 10.1128/MCB.01222-08. Epub 2009 Feb 2.

MicroRNA-1 negatively regulates expression of the hypertrophy-associated calmodulin and Mef2a genes

Affiliations

MicroRNA-1 negatively regulates expression of the hypertrophy-associated calmodulin and Mef2a genes

Sadakatsu Ikeda et al. Mol Cell Biol. 2009 Apr.

Abstract

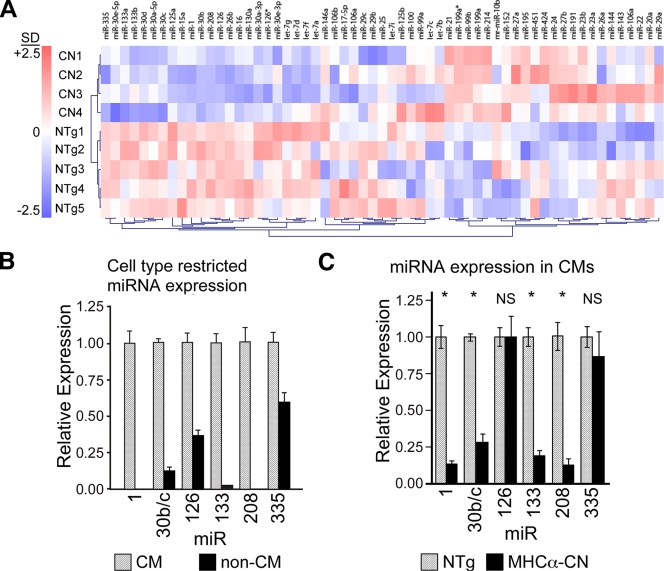
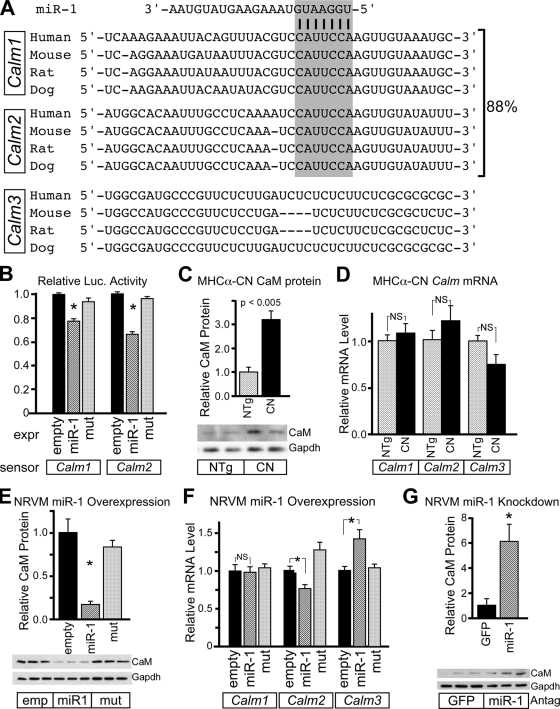
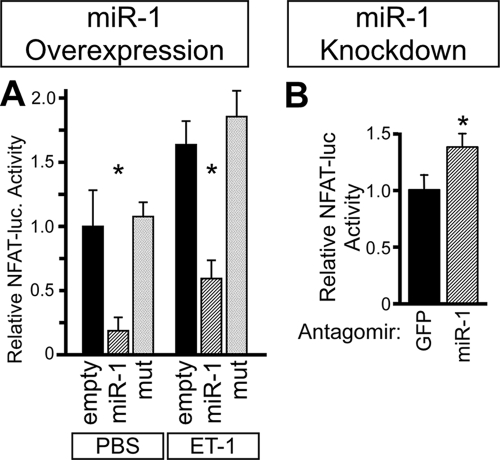
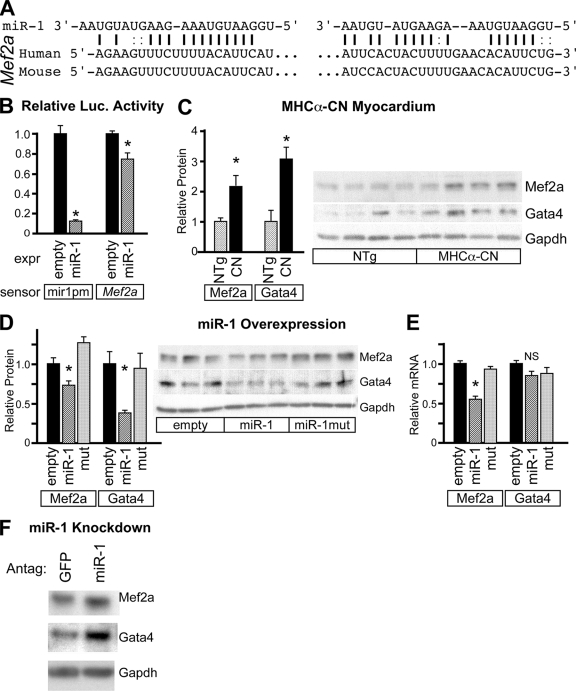
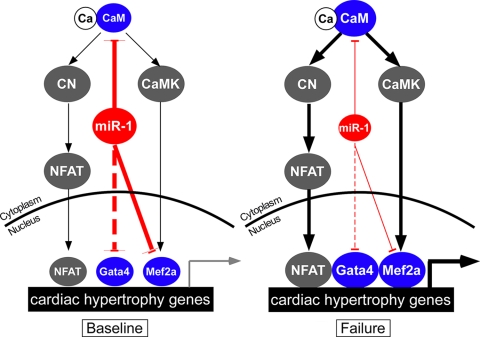
Calcium signaling is a central regulator of cardiomyocyte growth and function. Calmodulin is a critical mediator of calcium signals. Because the amount of calmodulin within cardiomyocytes is limiting, the precise control of calmodulin expression is important for the regulation of calcium signaling. In this study, we show for the first time that calmodulin levels are regulated posttranscriptionally in heart failure. The cardiomyocyte-restricted microRNA miR-1 inhibited the translation of calmodulin-encoding mRNAs via highly conserved target sites within their 3' untranslated regions. In keeping with its effect on calmodulin expression, miR-1 downregulated calcium-calmodulin signaling through calcineurin to NFAT. miR-1 also negatively regulated the expression of Mef2a and Gata4, key transcription factors that mediate calcium-dependent changes in gene expression. Consistent with the downregulation of these hypertrophy-associated genes, miR-1 attenuated cardiomyocyte hypertrophy in cultured neonatal rat cardiomyocytes and in the intact adult heart. Our data indicate that miR-1 regulates cardiomyocyte growth responses by negatively regulating the calcium signaling components calmodulin, Mef2a, and Gata4.


Figures

FIG. 1.
FIG. 1.
Altered miRNA expression levels in the MHCα-CN murine heart failure model. (A) Unsupervised clustering of miRNA expression profile in murine heart failure induced by transgenic expression of constitutively activated CN, compared with NTg. The color scale displays relative expression levels compared to the mean over all nine samples, where 2.5 in the color bar indicates 2.5 standard deviations (SD) from the nine-sample mean. (B) miRNA expression in wild-type cardiomyocytes (CMs) and adherent nonmyocytes (non-CMs) dissociated from nontransgenic hearts from 2-month-old animals. miRNA expression was normalized to U6 expression and displayed relative to the miRNA level in the CM fraction. (C) Expression of miRNAs in dissociated cardiomyocytes from MHCα-CN and NTg 2-month-old hearts normalized to U6 and displayed relative to expression in NTg hearts. qRT-PCR was used to measure miRNA expression (n = 3 for NTg, and n = 7 for CN). *, P < 0.002. NS, not significant.
FIG. 2.
FIG. 2.
miRNAs broadly influence gene expression. (A) mRNA abundance in NTg and MHCα-CN hearts was measured by Affymetrix microarrays (n = 4). Genes were grouped into four sets: all genes with detectable expression levels, miR-1 targets, miR-30 targets, and miR-133 targets. Target genes were predicted by TargetScanS. For each set, the percentage of upregulated (P < 0.005) genes was calculated. The likelihood that a randomly selected subset of all genes would yield a fraction of upregulated genes equal to or greater than the upregulated fraction in miRNA target sets was calculated by Fisher's exact test. This value is displayed within each bar. (B) Cardiomyocyte differentiation in P19CL6 cells was associated with a marked upregulation of miR-1, -133, and -208 expression. miR-30b/c showed a less-dynamic range of expression. Expression was displayed relative to day 10, which was defined as 1. (C) Affymetrix microarrays (n = 3) were used to measure mRNA levels at days 6 and 10 of P19CL6 differentiation. Downregulated genes (P < 0.05) were identified by Welch's t test. Predicted targets of miR-1 and -133 were disproportionately downregulated at a frequency unlikely to occur by chance (numbers within bars, Fisher's exact test).
FIG. 3.
FIG. 3.
miR-1 inhibited cardiomyocyte hypertrophy in cultured neonatal cardiomyocytes. (A) microRNA expression constructs. Constructs drove the expression of LacZ followed by no insert (empty [emp]), the miR-1 stem-loop (miR-1), or an miR-1 stem-loop containing two point mutations in the seed sequence (miR-1mut). The plasmid constructs were transfected into 293 cells, or their adenoviral derivatives were transduced into NRVMs. Northern blotting showed the appropriate expression of miR-1, increasing miR-1 levels in NRVMs by fivefold. The miR-1mut constructs did not efficiently express the mutated sequence. (B) Measurement of microRNA activity with a luciferase reporter. An assay sequence of interest was positioned downstream of luciferase. miRNA activity at the assay sequence reduced luciferase activity. To measure miR-1 activity, we used the reverse complement of miR-1 (1pm). The reverse complement of miR-208 was the negative control (208pm). Luciferase activity was normalized to activity for the cotransfected internal control (pRL-TK). For each luciferase sensor, normalized luciferase activity in the presence of the empty expression plasmid was assigned a value of 1. (C) Overexpression of miR-1, but not miR-1mut, reduced NRVM size at baseline and in response to ET-1 or ISO stimulation. Representative images of NRVMs stained with α-actinin (green) and DAPI (blue) are shown. *, P < 0.001 versus empty vector; †, P < 0.02. (D) Antagomir against miR-1 specifically inhibited miR-1 activity in NRVMs. NRVMs were transfected with miR-1 pm or miR-208 pm luciferase reporters and an internal control (pRL-TK) and then treated with the indicated antagomir. Luciferase activity was normalized to the internal control. For each luciferase sensor, normalized luciferase activity in the presence of GFP antagomir was assigned a value of 1. *, P < 0.001. (E) miR-1 knockdown with a specific antagomir (Antag) increased NRVM size at baseline and in response to ET-1 compared to the control antagomir directed against an unrelated sequence (GFP). Representative images of NRVMs stained with anti-actinin (green) and DAPI (blue) are shown. PBS, phosphate-buffered saline. *, P < 0.05; †, P < 0.001.
FIG. 4.
FIG. 4.
miR-1 inhibited adult cardiomyocyte hypertrophy. (A) Transthoracic intramyocardial injection of adenovirus under ultrasound guidance. A schematic of the ultrasound image is shown, with a needle penetrating the left ventricular myocardium (LV). (B) Dissociated cardiomyocytes. Cardiomyocytes with adenoviral miR-1 or miR-1mut overexpression were identified by the expression of LacZ, which stains blue with X-Gal. (C) Quantitation of cell size after expression of miR-1 or miR-1mut. miR-1 blocked cardiomyocyte hypertrophy in response to ISO. *, P < 0.001. NS, no significant difference (n = 4 per group).
FIG. 5.
FIG. 5.
miR-1 negatively regulates CaM and CaM-dependent NFAT signaling. (A) Conservation of miR-1 seed match sequence (gray box) in mammalian Calm1 and Calm2, which account for 88% of cardiac CaM-encoding transcripts (15). (B) Calm1 and Calm2 3′ UTRs contain miR-1-repressible sequences. When 3′ UTRs from Calm1 and Calm2 were positioned downstream of luciferase, luciferase activity was reduced by a cotransfected miR-1 expression plasmid. QBI293 cells were transfected with the indicated miR-1 expression (expr), luciferase sensor, and pRL-TK internal control plasmids. (C) The CaM protein was significantly upregulated in 2-month-old MHCα-CN hearts compared to nonlittermate controls. A representative Western blot is shown (n = 4). (D) CaM upregulation in MHCα-CN hearts was posttranscriptional. Calm1 to Calm3 mRNAs were measured by qRT-PCR. CN overexpression did not significantly alter mRNA levels of Calm1 to Calm3. (E) Adenoviral expression of miR-1 in NRVMs significantly reduced levels of the CaM protein compared to miR-1mut and empty (emp) negative controls. A representative Western blot is shown (n = 3). (F) Adenoviral miR-1 overexpression in NRVMs did not significantly alter Calm1 and Calm2 mRNA levels. There was a compensatory upregulation of Calm3 (n = 3). *, P < 0.05. (G) Antagomir (Antag)-mediated miR-1 knockdown increased CaM protein levels in NRVMs compared to unrelated antagomir against GFP (n = 3 per group). A representative Western blot is shown. *, P < 0.05. NS, not significant.
FIG. 6.
FIG. 6.
miR-1 negatively regulates NFAT signaling. (A) miR-1 overexpression inhibited NFAT-luciferase activity. NRVMs were treated with adenovirus containing an NFAT-dependent luciferase reporter and with the indicated miRNA-expressing adenoviruses. Levels of NFAT activity were increased by ET-1 and were decreased by miR-1 overexpression. *, P < 0.01 versus empty vector. (B) miR-1 knockdown increased NFAT-luciferase activity. NRVMs were treated NFAT-luciferase adenovirus and miR-1 or unrelated antagomir (GFP). *, P < 0.05 (n = 3). PBS, phosphate-buffered saline.
FIG. 7.
FIG. 7.
miR-1 negatively regulates Mef2a. (A) The 3′ UTR of Mef2a contains two conserved miR-1 recognition sequences. (B) The Mef2a 3′ UTR contains miR-1-repressible sequences. 3′ UTR sequences from Mef2a containing predicted miR-1 recognition sequences were cloned downstream of luciferase. Luciferase activity was reduced by a cotransfected miR-1 expression (expr) plasmid. QBI293 cells were transfected with the indicated miR expression, luciferase sensor, and pRL-TK internal control plasmids. (C) Mef2a and Gata4 proteins were upregulated in MHCα-CN myocardium compared to littermate controls. (D) Adenoviral expression of miR-1 in NRVMs significantly reduced levels of the Mef2a and Gata4 proteins compared to miR-1mut and the empty negative control. A representative Western blot is shown. (E) Adenoviral expression of miR-1 significantly downregulated Mef2a but not Gata4 mRNA levels. mRNA levels were determined by qRT-PCR. (F) Antagomir-mediated miR-1 knockdown increased levels of the Mef2a and Gata4 proteins in NRVMs compared to levels of unrelated antagomir against GFP. *, P < 0.05. NS, not significant.
FIG. 8.
FIG. 8.
miR-1 inhibits calcium-dependent signaling at multiple levels. Cardiac hypertrophy is regulated by calcium, which complexes with CaM to activate CN-NFAT and calcium-CaMK-Mef2 transcriptional pathways. Both of these pathways are stimulated by protein-protein interactions with Gata4. At baseline, miR-1 attenuates cardiomyocyte hypertrophy by downregulating the expression of CaM, Mef2, and Gata4. In heart failure, miR-1 expression is downregulated. This favors increased levels of expression of Gata4, Mef2a, and CaM. Increased levels of CaM augment Ca/CaM signaling through CN-NFAT (Fig. 6) and potentially also through CaMK. This results in an increased level of transcription of genes downstream of NFAT, Gata4, and Mef2a, promoting cardiac hypertrophy. The dotted line indicates indirect regulation.

Similar articles

Cited by

References

    1. Bartel, D. P. 2004. MicroRNAs: genomics, biogenesis, mechanism, and function. Cell 116281-297. - PubMed
    1. Baskerville, S., and D. P. Bartel. 2005. Microarray profiling of microRNAs reveals frequent coexpression with neighboring miRNAs and host genes. RNA 11241-247. - PMC - PubMed
    1. Betel, D., M. Wilson, A. Gabow, D. S. Marks, and C. Sander. 2008. The microRNA.org resource: targets and expression. Nucleic Acids Res. 36D149-D153. - PMC - PubMed
    1. Bisping, E., S. Ikeda, S. W. Kong, O. Tarnavski, N. Bodyak, J. R. McMullen, S. Rajagopal, J. K. Son, Q. Ma, Z. Springer, P. M. Kang, S. Izumo, and W. T. Pu. 2006. Gata4 is required for maintenance of postnatal cardiac function and protection from pressure overload-induced heart failure. Proc. Natl. Acad. Sci. USA 10314471-14476. - PMC - PubMed
    1. Bodyak, N., P. M. Kang, M. Hiromura, I. Sulijoadikusumo, N. Horikoshi, K. Khrapko, and A. Usheva. 2002. Gene expression profiling of the aging mouse cardiac myocytes. Nucleic Acids Res. 303788-3794. - PMC - PubMed

Publication types