Longevity is associated with increased vascular resistance to high glucose-induced oxidative stress and inflammatory gene expression in Peromyscus leucopus
- PMID: 19181967
- PMCID: PMC2670687
- DOI: 10.1152/ajpheart.00693.2008
Longevity is associated with increased vascular resistance to high glucose-induced oxidative stress and inflammatory gene expression in Peromyscus leucopus
Abstract
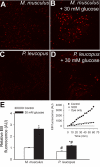
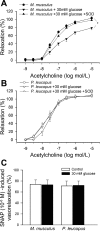
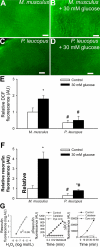
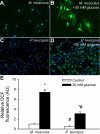
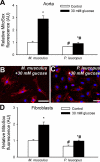
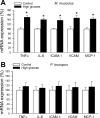
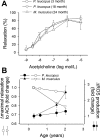
Vascular aging is characterized by increased oxidative stress and proinflammatory phenotypic alterations. Metabolic stress, such as hyperglycemia in diabetes, is known to increase the production of ROS and promote inflammatory gene expression, accelerating vascular aging. The oxidative stress hypothesis of aging predicts that vascular cells of long-lived species exhibit lower steady-state production of ROS and/or superior resistance to the prooxidant effects of metabolic stress. We tested this hypothesis using two taxonomically related rodents, the white-footed mouse (Peromyscus leucopus) and the house mouse (Mus musculus), which show a more than twofold difference in maximum lifespan potential (8.2 and 3.5 yr, respectively). We compared interspecies differences in steady-state and high glucose (HG; 30 mmol/l)-induced production of O(2)(*-) and H(2)O(2), endothelial function, mitochondrial ROS generation, and inflammatory gene expression in cultured aortic segments. In P. leucopus aortas, steady-state endothelial O(2)(*-) and H(2)O(2) production and ROS generation by mitochondria were less than in M. musculus vessels. Furthermore, vessels of P. leucopus were more resistant to the prooxidant effects of HG. Primary fibroblasts from P. leucopus also exhibited less steady-state and HG-induced ROS production than M. musculus cells. In M. musculus arteries, HG elicited significant upregulation of inflammatory markers (TNF-alpha, IL-6, ICAM-1, VCAM, and monocyte chemoattractant protein-1). In contrast, the proinflammatory effects of HG were blunted in P. leucopus vessels. Thus, increased life span potential in P. leucopus is associated with decreased cellular ROS generation and increased resistance to prooxidant and proinflammatory effects of metabolic stress, which accord with predictions of the oxidative stress hypothesis of aging.
Figures

Similar articles
-
Reduced mitochondrial ROS, enhanced antioxidant defense, and distinct age-related changes in oxidative damage in muscles of long-lived Peromyscus leucopus.Am J Physiol Regul Integr Comp Physiol. 2013 Mar 1;304(5):R343-55. doi: 10.1152/ajpregu.00139.2012. Epub 2013 Jan 16. Am J Physiol Regul Integr Comp Physiol. 2013. PMID: 23325454 Free PMC article.
-
Vascular superoxide and hydrogen peroxide production and oxidative stress resistance in two closely related rodent species with disparate longevity.Aging Cell. 2007 Dec;6(6):783-97. doi: 10.1111/j.1474-9726.2007.00339.x. Epub 2007 Oct 8. Aging Cell. 2007. PMID: 17925005
-
Testing hypotheses of aging in long-lived mice of the genus Peromyscus: association between longevity and mitochondrial stress resistance, ROS detoxification pathways, and DNA repair efficiency.Age (Dordr). 2008 Sep;30(2-3):121-33. doi: 10.1007/s11357-008-9059-y. Epub 2008 Jun 14. Age (Dordr). 2008. PMID: 19424862 Free PMC article.
-
Longevity, aging and comparative cellular and molecular biology of the house mouse, Mus musculus, and the white-footed mouse, Peromyscus leucopus.Birth Defects Orig Artic Ser. 1978;14(1):71-96. Birth Defects Orig Artic Ser. 1978. PMID: 343832 Review. No abstract available.
-
Oxidative stress and vascular inflammation in aging.Free Radic Biol Med. 2013 Dec;65:380-401. doi: 10.1016/j.freeradbiomed.2013.07.003. Epub 2013 Jul 10. Free Radic Biol Med. 2013. PMID: 23851032 Review.
Cited by
-
Reduced mitochondrial ROS, enhanced antioxidant defense, and distinct age-related changes in oxidative damage in muscles of long-lived Peromyscus leucopus.Am J Physiol Regul Integr Comp Physiol. 2013 Mar 1;304(5):R343-55. doi: 10.1152/ajpregu.00139.2012. Epub 2013 Jan 16. Am J Physiol Regul Integr Comp Physiol. 2013. PMID: 23325454 Free PMC article.
-
Testing the oxidative stress hypothesis of aging in primate fibroblasts: is there a correlation between species longevity and cellular ROS production?J Gerontol A Biol Sci Med Sci. 2012 Aug;67(8):841-52. doi: 10.1093/gerona/glr216. Epub 2012 Jan 4. J Gerontol A Biol Sci Med Sci. 2012. PMID: 22219516 Free PMC article.
-
Mitochondria and aging in the vascular system.J Mol Med (Berl). 2010 Oct;88(10):1021-7. doi: 10.1007/s00109-010-0667-5. Epub 2010 Aug 17. J Mol Med (Berl). 2010. PMID: 20714704 Free PMC article.
-
The white-footed deermouse, an infection-tolerant reservoir for several zoonotic agents, tempers interferon responses to endotoxin in comparison to the mouse and rat.bioRxiv [Preprint]. 2023 Oct 12:2023.06.06.543964. doi: 10.1101/2023.06.06.543964. bioRxiv. 2023. Update in: Elife. 2024 Jan 09;12:RP90135. doi: 10.7554/eLife.90135 PMID: 37745581 Free PMC article. Updated. Preprint.
-
Peromyscus leucopus mice: a potential animal model for haematological studies.Int J Exp Pathol. 2014 Oct;95(5):342-50. doi: 10.1111/iep.12091. Epub 2014 Aug 12. Int J Exp Pathol. 2014. PMID: 25116892 Free PMC article.
References
-
- Adler A, Messina E, Sherman B, Wang Z, Huang H, Linke A, Hintze TH. NAD(P)H oxidase-generated superoxide anion accounts for reduced control of myocardial O2 consumption by NO in old Fischer-344 rats. Am J Physiol Heart Circ Physiol 285: H1015–H1022, 2003. - PubMed
-
- Arking DE, Atzmon G, Arking A, Barzilai N, Dietz HC. Association between a functional variant of the KLOTHO gene and high-density lipoprotein cholesterol, blood pressure, stroke, and longevity. Circ Res 96: 412–418, 2005. - PubMed
-
- Austad SN An experimental paradigm for the study of slowly aging organisms. Exp Gerontol 36: 599–605, 2001. - PubMed
-
- Austad SN, Fischer KE. Mammalian aging, metabolism, and ecology: evidence from the bats and marsupials. J Gerontol 46: B47–B53, 1991. - PubMed
Publication types
MeSH terms
Substances
Grants and funding
LinkOut - more resources
Full Text Sources
Molecular Biology Databases
Research Materials
Miscellaneous

