. 2009 Mar 4;28(5):477-89.
doi: 10.1038/emboj.2008.308. Epub 2009 Jan 29.

The novel lipid raft adaptor p18 controls endosome dynamics by anchoring the MEK-ERK pathway to late endosomes

Affiliations

The novel lipid raft adaptor p18 controls endosome dynamics by anchoring the MEK-ERK pathway to late endosomes

Shigeyki Nada et al. EMBO J. .

Abstract

The regulation of endosome dynamics is crucial for fundamental cellular functions, such as nutrient intake/digestion, membrane protein cycling, cell migration and intracellular signalling. Here, we show that a novel lipid raft adaptor protein, p18, is involved in controlling endosome dynamics by anchoring the MEK1-ERK pathway to late endosomes. p18 is anchored to lipid rafts of late endosomes through its N-terminal unique region. p18(-/-) mice are embryonic lethal and have severe defects in endosome/lysosome organization and membrane protein transport in the visceral endoderm. p18(-/-) cells exhibit apparent defects in endosome dynamics through perinuclear compartment, such as aberrant distribution and/or processing of lysosomes and impaired cycling of Rab11-positive recycling endosomes. p18 specifically binds to the p14-MP1 complex, a scaffold for MEK1. Loss of p18 function excludes the p14-MP1 complex from late endosomes, resulting in a downregulation of the MEK-ERK activity. These results indicate that the lipid raft adaptor p18 is essential for anchoring the MEK-ERK pathway to late endosomes, and shed new light on a role of endosomal MEK-ERK pathway in controlling endosome dynamics.


Figures
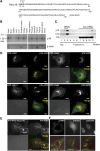
Figure 1
Figure 1
Identification of p18 as a late endosomal protein. (A) Primary structure of rat p18. Potential myristoylation and palmitoylation sites are indicated by m and p, respectively. Amino-acid numbers are shown under the primary sequence. (B) Northern blot analysis of p18 transcripts in mouse tissues. Control β-actin blots are also shown. (C) MEFs were treated with Triton X-100 and separated into DRM and non-DRM fractions on a sucrose gradient. Each fraction was immunoblotted with anti-p18, CTX and anti-transferrin receptor (TfR) antibodies. (D) Colocalization of GFP–Rab7, GFP–Rab5, GFP–Rab11 and GFP–Rab4 with p18–mKO in p18−/− cells (Supplementary Figure S3). Scale bar: 10 μm. (E) Double immunostaining of p18rev cells (Supplementary Figure S3) with anti-Strep tag and anti-Rab7 antibodies. Higher magnification images of the indicated areas are shown in the insets. (F) Localization of wild-type p18 and p18 mutants (p18G2A and p18C3/4A) in p18−/− cells (upper panels). Localization of p18 deletion mutants (p18N10, p18N20 and p18N39) was evaluated by co-transfection with wild-type p18 (lower panels). Merged images are shown.
Figure 2
Figure 2
Phenotypes of p18 knockout mice. (A) Schematic diagram of the p18 gene and targeting vector containing the Neo-resistance gene (neo) as a positive selection marker and the thymidine kinase gene (tk) as a negative selection marker. Locations of PCR primer sequences designed for screening (S1–N1, G3–S2, N2–S2 and N2–S3) and genotyping (G1–G2 and G1–N1) are shown. Details are described in the legend to Supplementary Figure S2. (B) Immunohistochemical analysis of control (cont) and mutant (mut) E6.5 embryos using anti-p18 antibody. Scale bar: 50 μm. Insets show enlarged views of the white boxes. (C) Haematoxylin and eosin (HE)-stained sections of E7 embryos. Lower panels show enlarged views of the white boxes in upper panels. The visceral endoderm (VE) in the mutant embryo and the corresponding visceral yolk sac in the control embryo are indicated. Scale bar: 100 μm in upper panels, 10 μm in lower panels. (D) Immunohistochemical analysis of control and mutant E7 embryos using anti-LAMP-1 antibody. (E) Electron microscopy sections showing E6.5 VE. Boxed areas are enlarged in lower panels. Red asterisks in the control section indicate large lysosomal structures (Anderson and Jacobson, 2002; Zheng et al, 2006), and yellow arrowheads in the mutant section indicate small lysosomal structures with amorphous substances. Scale bar: 5 μm. (F) Immunohistochemical analysis of control and mutant E7 embryos using anti-cubilin (upper) and anti-megalin (lower) antibody. Differential interference contrast (DIC) images are shown in the right panels. Scale bar: 10 μm.
Figure 3
Figure 3
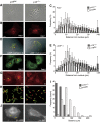
Analysis of p18−/− cells. (A) Phase-contrast images of growing p18rev (left) and p18−/− (right) cells. (B) Immunofluorescence analysis of Rab7-positive late endosomes in p18rev and p18−/− cells. (C) Semiquantitative analysis of the distribution of Rab7-positive late endosomes in the cells. The frequency distributions were measured in distances from the nucleus (n=17 cells). χ2 independence test; P<0.001. (D) Immunofluorescence analysis of LAMP-1 (green) and cathepsin D (red) in p18rev and p18−/− cells. Merged images are shown. Asterisk indicates the location of PNRC. (E) Semiquantitative analysis of the distribution of LAMP-1-positive lysosomes in the cells (Supplementary Figure S4). The frequency distributions were measured in distances from the nucleus (n=17 cells). χ2 independence test; P<0.001. (F) Immunofluorescence analysis of Rab11-positive endosomes in p18rev and p18−/− cells. (G) Fluorescence images of transferrin-Alexa 594 (Tf) incorporated into p18rev and p18−/− cells. (H) Time-lapse imaging of cell migration of p18−/− and p18rev cells. Representative tracks for 16 h are shown. (I) Histograms of the migration distance for 4 h of 25 μm windows are shown for p18rev and p18−/− cells. (J) Time-lapse imaging of integrin β1–GFP (β1–GFP) in p18−/− and p18rev cells. QuickTime movies are provided in Supplementary Movies S1 and S2.
Figure 4
Figure 4
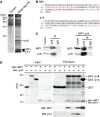
Identification of the p14–MP1 complex as p18-binding proteins. (A) Silver staining of p18-binding proteins purified from control MEFs and strep-tagged p18-expressing MEFs. Arrowheads, MP1 and p14 identified by LC-MS/MS. (B) Amino-acid sequences of MP1 and p14. Peptide sequences obtained by LC-MS/MS are indicated in red. (C) p18 was immunoprecipitated from normal or GFP–p14-expressing MEFs, and immunoblotted with anti-MP1 and anti-p18 (left) or anti-GFP and anti-p18 (right) antibodies. As input controls, 16% of total cell lysate was analysed. (D) In vitro binding assays among p18, p14 and MP1. As input controls, 7% of GST, GST–p18, His–MP1 and His–p14 used for pull down assay were separated by SDS–PAGE and stained with Coomassie brilliant blue (CBB, left panel). GST, GST–p18 or GST–p14 was incubated with His–MP1 and/or His–p14, and the complexes were pulled down with glutathione beads, followed by staining with CBB and immunoblotting with anti-MP1 and anti-p14 (right panels). Locations of GST, GST–p18, His–MP1 and His–p14 are indicated.
Figure 5
Figure 5
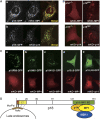
Interaction between p18 and the p14–MP1 complex. (A) Colocalization of p18–GFP and mKO–MP1 (a) or mKO–p14 (b) in MEFs. (B) Intracellular localization of mKO–MP1 (upper) and mKO–p14 (lower) in p18−/− (left) and p18rev (right) cells. (C) p18−/− cells were co-transfected with GFP fusions with p18 deletion mutants containing aa 1–39 (p18N39, a), 1–81 (p18N81, b), 1–121 (p18N121, c), 6–161 (p18Δ5, d) and 41–161 (p18Δ40, e), and mKO–MP1 or mKO–p14. Intracellular distribution of each construct is shown. (D) A schematic model of the interaction domains of p18. Myr, myristate; Pal, palmitate; LT, late endosome targeting domain; p14–MP1 BD, p14–MP1-binding domain.
Figure 6
Figure 6
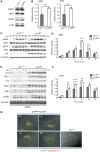
Effects of p18 loss on the MEK–ERK activity. (A) Total cell lysates from p18−/− and p18rev cells grown under normal growth conditions were immunoblotted with the indicated antibodies. (B) Mean±s.d. of the relative activities of MEK (left) and ERK (right) in p18rev (n=4) and p18−/− (n=4) cells are shown. ***P<0.001 by Student's t-test. (C) p18−/− and p18rev cells cultured in the presence of 0.1% serum were treated with EGF (100 ng/ml). Cell lysates prepared at the indicated time points were immunoblotted with the indicated antibodies. (D) Means±s.d. of the relative activity of MEK in p18rev (n=4, white) and p18−/− (n=4, grey) cells are shown. Differences between groups were analysed by using repeated measures analysis of variance (ANOVA); P=0.0013. Differences at the indicated time points were analysed by Student's t-test; **P<0.01; ***P<0.001. (E) Cell lysates prepared from p18−/− and p18rev cells treated with EGF for the indicated times were immunoblotted with the indicated antibodies. Caveolin was detected as a control of DRMs. (F) Means±s.d. of the relative activity of ERK in DRM fractions from p18rev (n=4, white) and p18−/− (n=4, grey) cells are shown. Differences between groups were analysed by using repeated measures ANOVA; P=0.0008. Differences at the indicated time points were analysed by Student's t-test; **P<0.01; ***P<0.001. (G) p18rev was treated with U0126 (10 μM) for the indicated periods, and was co-stained with anti-LAMP-1 and anti-cathepsin D antibodies. Merged images are shown. An image of p18−/− cell is also shown.
Figure 7
Figure 7
The p18–MEK–ERK pathway in the intracellular organelle dynamics. A schematic model of p18 function. p18 serves as a lipid raft anchor for p14–MP1–MEK1 signalling components on late endosomes. The loss of p18 function or the inhibition of MEK activity causes defects in membrane dynamics, including Rab11-mediated endosome recycling and lysosome processing. From these observations, it is suggested that the p18–MEK–ERK pathway anchored to intracellular lipid rafts takes part in controlling intracellular membrane dynamics potentially by regulating organelle interactions and/or transports along cytoskeletons. MTOC, microtubule organizing centre; PNRC, perinuclear recycling compartment.

Similar articles

Cited by

References

    1. Anderson RG, Jacobson K (2002) A role for lipid shells in targeting proteins to caveolae, rafts, and other lipid domains. Science 296: 1821–1825 - PubMed
    1. Balasubramanian N, Scott DW, Castle JD, Casanova JE, Schwartz MA (2007) Arf6 and microtubules in adhesion-dependent trafficking of lipid rafts. Nat Cell Biol 9: 1381–1391 - PMC - PubMed
    1. Balbis A, Parmar A, Wang Y, Baquiran G, Posner BI (2007) Compartmentalization of signaling-competent epidermal growth factor receptors in endosomes. Endocrinology 148: 2944–2954 - PubMed
    1. Bielinska M, Narita N, Wilson DB (1999) Distinct roles for visceral endoderm during embryonic mouse development. Int J Dev Biol 43: 183–205 - PubMed
    1. Bohn G, Allroth A, Brandes G, Thiel J, Glocker E, Schaffer AA, Rathinam C, Taub N, Teis D, Zeidler C, Dewey RA, Geffers R, Buer J, Huber LA, Welte K, Grimbacher B, Klein C (2007) A novel human primary immunodeficiency syndrome caused by deficiency of the endosomal adaptor protein p14. Nat Med 13: 38–45 - PubMed

Publication types

MeSH terms

Substances