

Contrasting activity profile of two distributed cortical networks as a function of attentional demands
- PMID: 19176827
- PMCID: PMC2667329
- DOI: 10.1523/JNEUROSCI.4867-08.2009
Contrasting activity profile of two distributed cortical networks as a function of attentional demands
Abstract
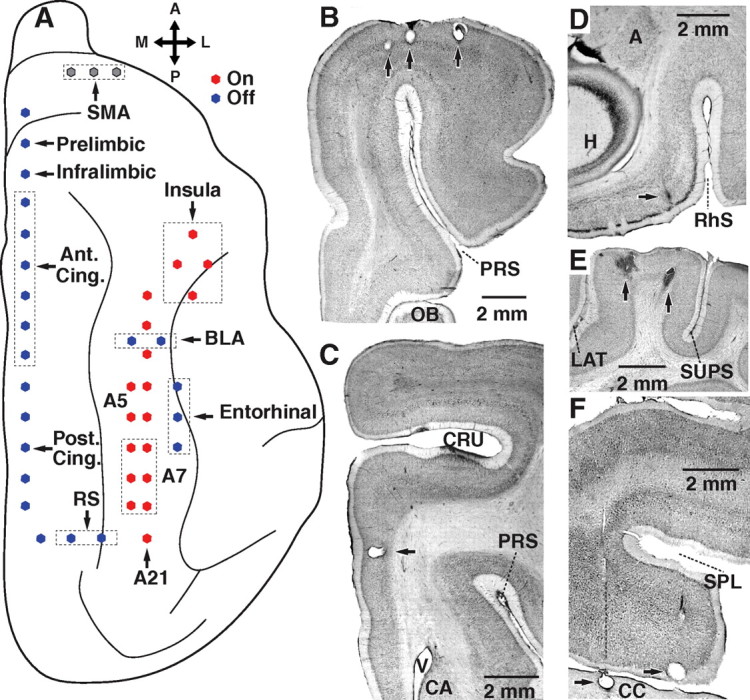
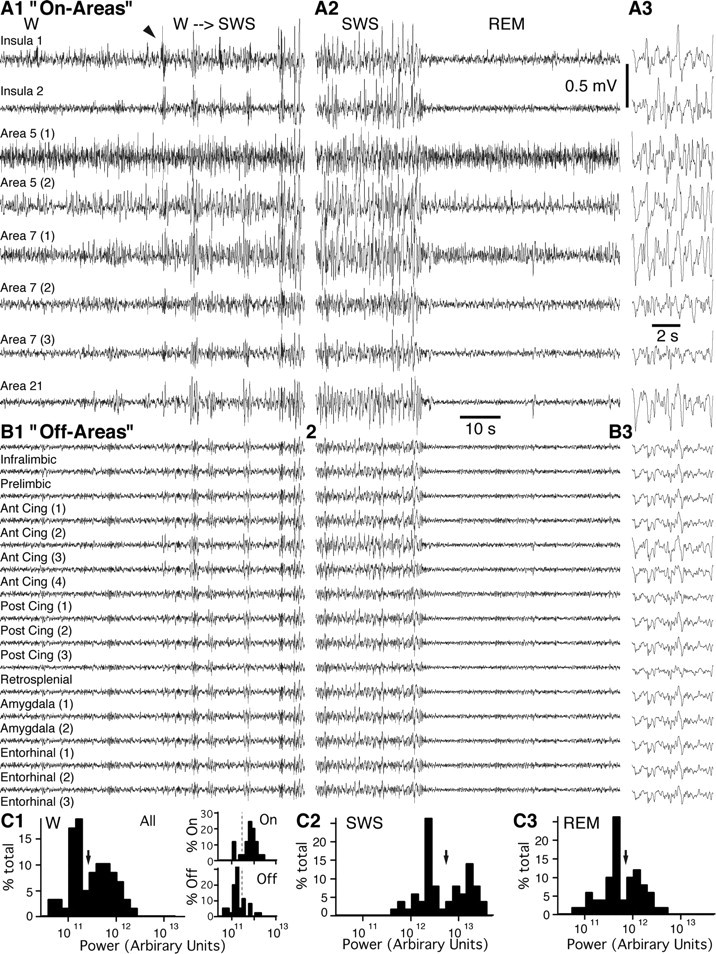
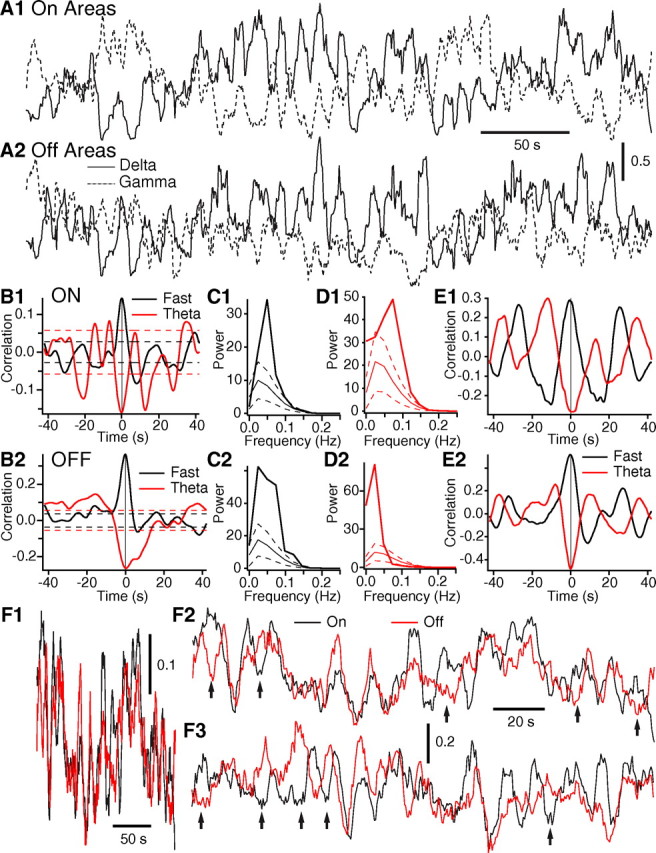
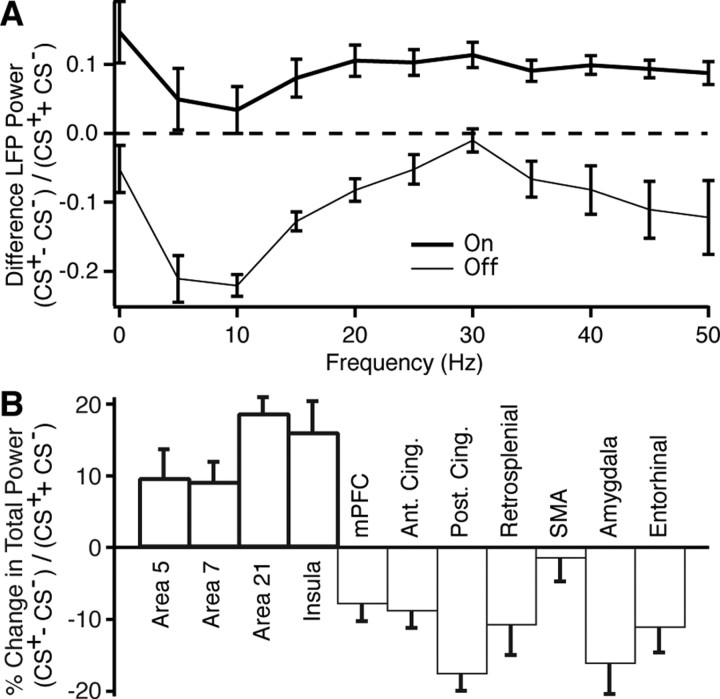
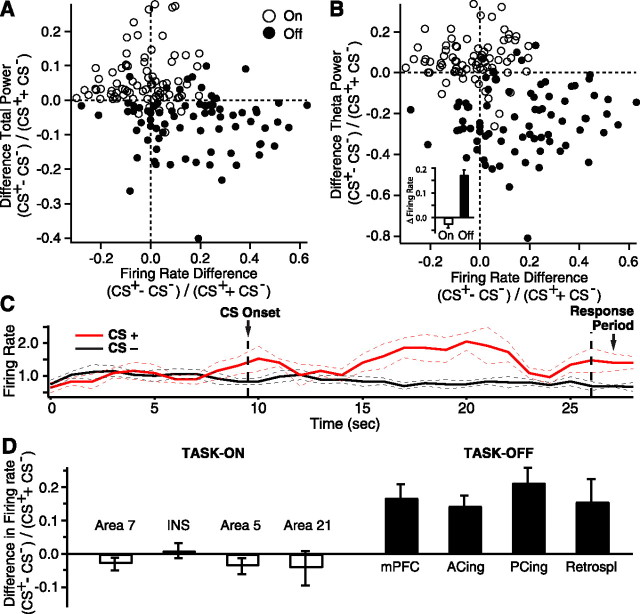
Recent human functional MRI (fMRI) studies have revealed that two widely distributed groups of cortical areas display inverse changes in activity when attentional demands increase, with one group showing higher (task-on) and the second lower (task-off) blood oxygen level-dependent (BOLD) signals. Moreover, task-on and task-off regions also exhibit slow (<0.2 Hz) inversely correlated fluctuations in BOLD signal at rest. However, the neuronal correlates of these reciprocal BOLD signal fluctuations are unknown. Here, we addressed this question using simultaneous recordings of unit activity and local field potentials (LFPs) in the cat homologues of task-on and task-off regions. In all states of vigilance, LFP power was lower in task-off than task-on regions with no difference in firing rates. Both sets of regions displayed slow (0.5-0.15 Hz) cyclical modulations in LFP power in all frequency bands but with large and variable phase differences such that task-on and task-off regions were often anticorrelated. Inversely correlated LFP power fluctuations were state-dependent in that they were much more frequent in waking and paradoxical sleep than in slow-wave sleep. Moreover, consistent with fMRI findings, when attentional demands increased, LFP power in task-on and task-off regions changed in opposite directions, further augmenting and decreasing, respectively. At odds with previous fMRI studies, however, the decreased LFP power in task-off regions was associated with increased firing rates, suggesting that the engagement of task-off regions might not be reduced but in fact enhanced during attention.
Conflict of interest statement
The authors declare no competing financial interests.
Figures


Similar articles
-
Interhemispheric correlations of slow spontaneous neuronal fluctuations revealed in human sensory cortex.Nat Neurosci. 2008 Sep;11(9):1100-8. doi: 10.1038/nn.2177. Nat Neurosci. 2008. PMID: 19160509 Free PMC article.
-
Oxygen Level and LFP in Task-Positive and Task-Negative Areas: Bridging BOLD fMRI and Electrophysiology.Cereb Cortex. 2016 Jan;26(1):346-57. doi: 10.1093/cercor/bhu260. Epub 2014 Nov 10. Cereb Cortex. 2016. PMID: 25385710 Free PMC article.
-
Infraslow LFP correlates to resting-state fMRI BOLD signals.Neuroimage. 2013 Jul 1;74:288-97. doi: 10.1016/j.neuroimage.2013.02.035. Epub 2013 Feb 26. Neuroimage. 2013. PMID: 23481462 Free PMC article.
-
The neural basis of the blood-oxygen-level-dependent functional magnetic resonance imaging signal.Philos Trans R Soc Lond B Biol Sci. 2002 Aug 29;357(1424):1003-37. doi: 10.1098/rstb.2002.1114. Philos Trans R Soc Lond B Biol Sci. 2002. PMID: 12217171 Free PMC article. Review.
-
On the relationship between slow cortical potentials and BOLD signal changes in humans.Int J Psychophysiol. 2008 Mar;67(3):252-61. doi: 10.1016/j.ijpsycho.2007.05.018. Epub 2007 Jul 12. Int J Psychophysiol. 2008. PMID: 17669531 Review.
Cited by
-
The cell-intrinsic requirement of Sox6 for cortical interneuron development.Neuron. 2009 Aug 27;63(4):466-81. doi: 10.1016/j.neuron.2009.08.005. Neuron. 2009. PMID: 19709629 Free PMC article.
-
Disease and the brain's dark energy.Nat Rev Neurol. 2010 Jan;6(1):15-28. doi: 10.1038/nrneurol.2009.198. Nat Rev Neurol. 2010. PMID: 20057496 Review.
-
Selective development of anticorrelated networks in the intrinsic functional organization of the human brain.J Cogn Neurosci. 2014 Mar;26(3):501-13. doi: 10.1162/jocn_a_00517. Epub 2013 Nov 4. J Cogn Neurosci. 2014. PMID: 24188367 Free PMC article.
-
Frontoparietal correlation dynamics reveal interplay between integration and segregation during visual working memory.J Neurosci. 2014 Oct 8;34(41):13600-13. doi: 10.1523/JNEUROSCI.1961-14.2014. J Neurosci. 2014. PMID: 25297089 Free PMC article.
-
Effective artifact removal in resting state fMRI data improves detection of DMN functional connectivity alteration in Alzheimer's disease.Front Hum Neurosci. 2015 Aug 11;9:449. doi: 10.3389/fnhum.2015.00449. eCollection 2015. Front Hum Neurosci. 2015. PMID: 26321937 Free PMC article.
References
-
- Arvesen JN. Jackknifing U-statistics. Ann Math Stat. 1969;40:2076–2100.
-
- Azouz R, Gray CM, Nowak LG, McCormick DA. Physiological properties of inhibitory interneurons in cat striate cortex. Cereb Cortex. 1997;7:534–545. - PubMed
-
- Binder JR, Frost JA, Hammeke TA, Bellgowan PS, Rao SM, Cox RW. Conceptual processing during the conscious resting state. A functional MRI study. J Cogn Neurosci. 1999;11:80–95. - PubMed
-
- Buia C, Tiesinga P. Attentional modulation of firing rate and synchrony in a model cortical network. J Comput Neurosci. 2006;20:247–264. - PubMed
-
- Buschman TJ, Miller EK. Top-down versus bottom-up control of attention in the prefrontal and posterior parietal cortices. Science. 2007;315:1860–1862. - PubMed
Publication types
MeSH terms
Substances
Grants and funding
LinkOut - more resources
Full Text Sources
Other Literature Sources
Miscellaneous