

Induction of a striking systemic cytokine cascade prior to peak viremia in acute human immunodeficiency virus type 1 infection, in contrast to more modest and delayed responses in acute hepatitis B and C virus infections
- PMID: 19176632
- PMCID: PMC2663284
- DOI: 10.1128/JVI.01844-08
Induction of a striking systemic cytokine cascade prior to peak viremia in acute human immunodeficiency virus type 1 infection, in contrast to more modest and delayed responses in acute hepatitis B and C virus infections
Abstract
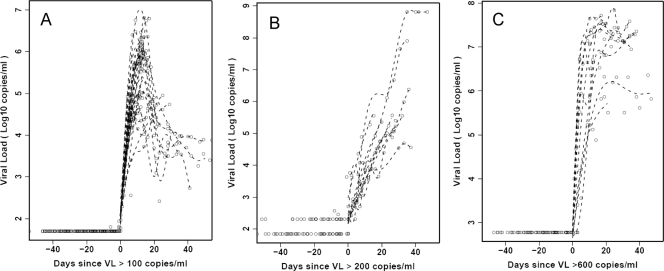
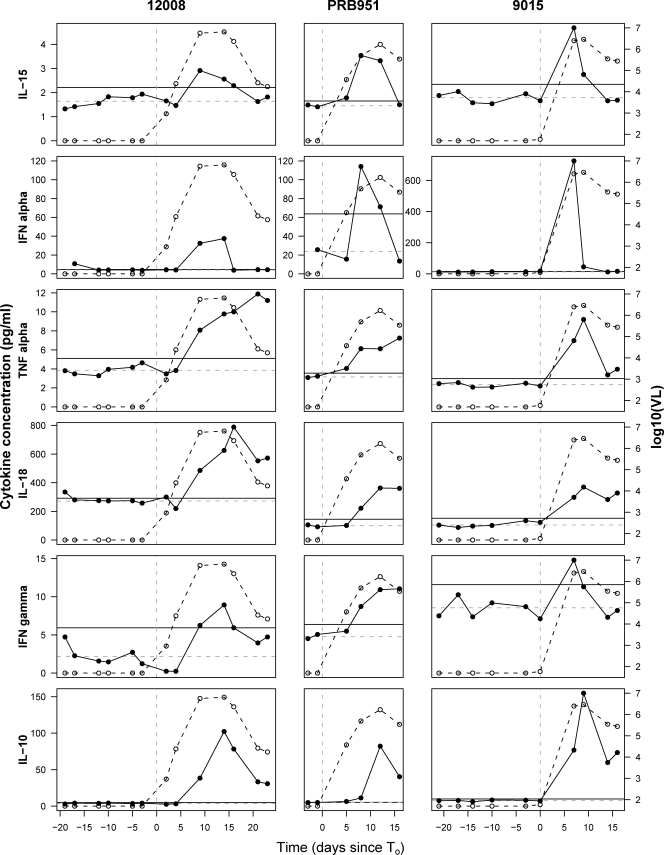
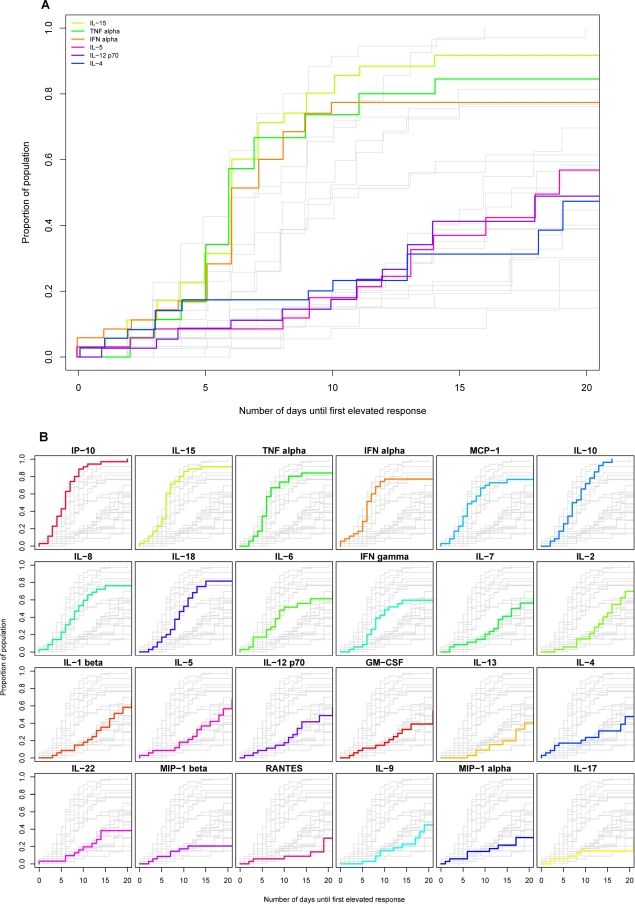
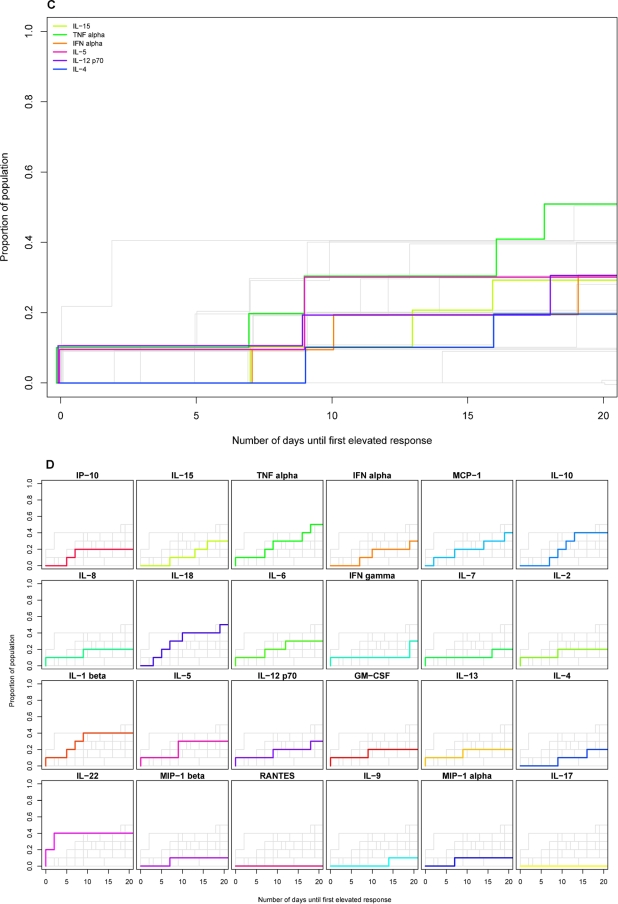
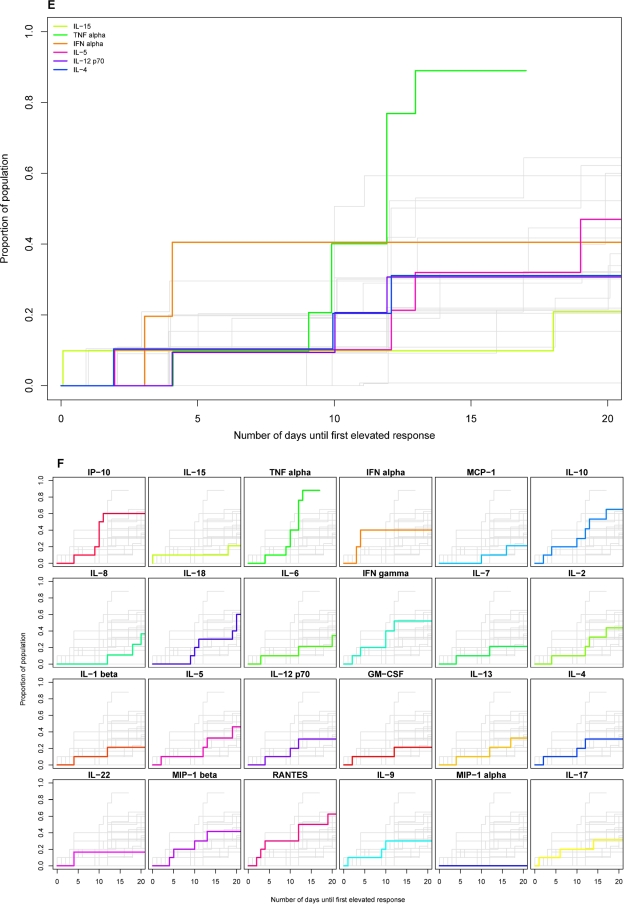
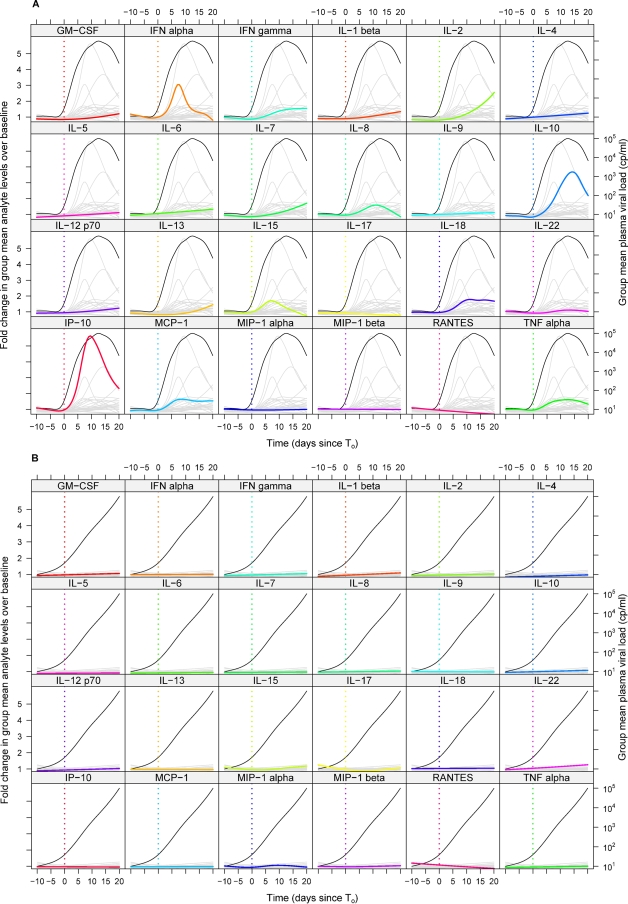
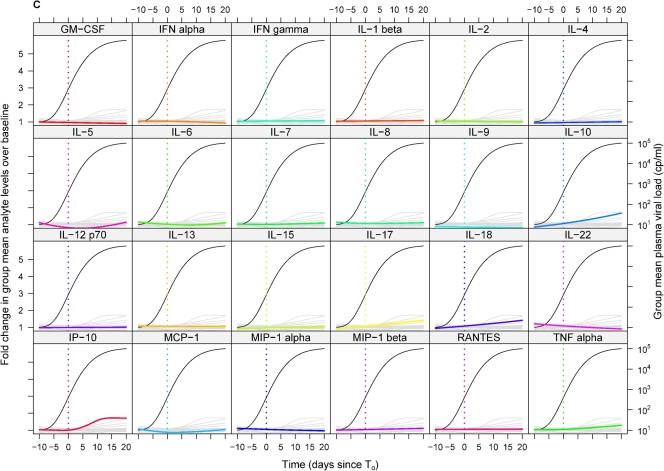
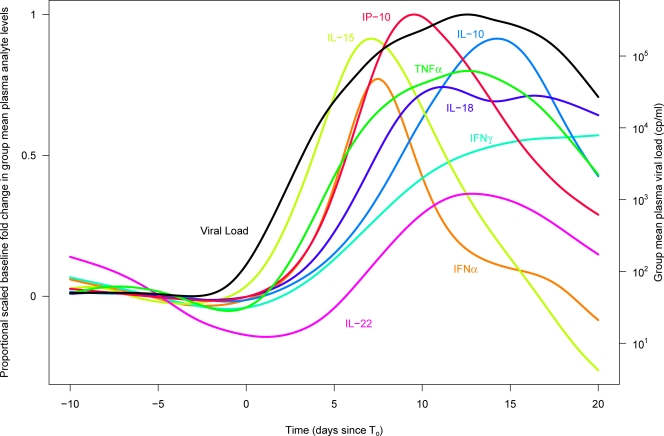
Characterization of the immune responses induced in the initial stages of human immunodeficiency virus type 1 (HIV-1) infection is of critical importance for an understanding of early viral pathogenesis and prophylactic vaccine design. Here, we used sequential plasma samples collected during the eclipse and exponential viral expansion phases from subjects acquiring HIV-1 (or, for comparison, hepatitis B virus [HBV]or hepatitis C virus [HCV]) to determine the nature and kinetics of the earliest systemic elevations in cytokine and chemokine levels in each infection. Plasma viremia was quantitated over time, and levels of 30 cytokines and chemokines were measured using Luminex-based multiplex assays and enzyme-linked immunosorbent assays. The increase in plasma viremia in acute HIV-1 infection was found to be associated with elevations in plasma levels of multiple cytokines and chemokines, including rapid and transient elevations in alpha interferon (IFN-alpha) and interleukin-15 (IL-15) levels; a large increase in inducible protein 10 (IP-10) levels; rapid and more-sustained increases in tumor necrosis factor alpha and monocyte chemotactic protein 1 levels; more slowly initiated elevations in levels of additional proinflammatory factors including IL-6, IL-8, IL-18, and IFN-gamma; and a late-peaking increase in levels of the immunoregulatory cytokine IL-10. Notably, there was comparatively little perturbation in plasma cytokine levels during the same phase of HBV infection and a delayed response of more intermediate magnitude in acute HCV infection, indicating that the rapid activation of a striking systemic cytokine cascade is not a prerequisite for viral clearance (which occurs in a majority of HBV-infected individuals). The intense early cytokine storm in acute HIV-1 infection may have immunopathological consequences, promoting immune activation, viral replication, and CD4(+) T-cell loss.
Figures
Similar articles
-
Distinct Cytokine Profiles Correlate with Disease Severity and Outcome in Longitudinal Studies of Acute Hepatitis B Virus and Hepatitis D Virus Infection in Chimpanzees.mBio. 2020 Nov 17;11(6):e02580-20. doi: 10.1128/mBio.02580-20. mBio. 2020. PMID: 33203756 Free PMC article.
-
Magnitude and Quality of Cytokine and Chemokine Storm during Acute Infection Distinguish Nonprogressive and Progressive Simian Immunodeficiency Virus Infections of Nonhuman Primates.J Virol. 2016 Oct 28;90(22):10339-10350. doi: 10.1128/JVI.01061-16. Print 2016 Nov 15. J Virol. 2016. PMID: 27630228 Free PMC article.
-
Study on the blood-borne virus co-infection and T lymphocyte subset among intravenous drug users.World J Gastroenterol. 2007 Apr 28;13(16):2357-62. doi: 10.3748/wjg.v13.i16.2357. World J Gastroenterol. 2007. PMID: 17511038 Free PMC article.
-
Cytokines in viral hepatitis.Semin Liver Dis. 1999;19(2):157-69. doi: 10.1055/s-2007-1007107. Semin Liver Dis. 1999. PMID: 10422198 Review.
-
Host-virus interactions in hepatitis B and hepatitis C infection.J Gastroenterol. 2016 May;51(5):409-20. doi: 10.1007/s00535-016-1183-3. Epub 2016 Feb 19. J Gastroenterol. 2016. PMID: 26894594 Review.
Cited by
-
Nef defect attenuates HIV viremia and immune dysregulation in the bone marrow-liver-thymus-spleen (BLTS) humanized mouse model.Virology. 2024 Oct;598:110192. doi: 10.1016/j.virol.2024.110192. Epub 2024 Jul 31. Virology. 2024. PMID: 39106585 Free PMC article.
-
IFIH1 (MDA5) is required for innate immune detection of intron-containing RNA expressed from the HIV-1 provirus.Proc Natl Acad Sci U S A. 2024 Jul 16;121(29):e2404349121. doi: 10.1073/pnas.2404349121. Epub 2024 Jul 10. Proc Natl Acad Sci U S A. 2024. PMID: 38985764 Free PMC article.
-
Alterations in the iron homeostasis network: A driving force for macrophage-mediated hepatitis C virus persistency.Virulence. 2016 Aug 17;7(6):679-90. doi: 10.1080/21505594.2016.1175700. Epub 2016 Apr 8. Virulence. 2016. PMID: 27058404 Free PMC article.
-
Maturational characteristics of HIV-specific antibodies in viremic individuals.JCI Insight. 2016;1(3):e84610. doi: 10.1172/jci.insight.84610. Epub 2016 Mar 17. JCI Insight. 2016. PMID: 27152362 Free PMC article.
-
Optimization and qualification of a multiplex bead array to assess cytokine and chemokine production by vaccine-specific cells.J Immunol Methods. 2012 Aug 31;382(1-2):117-28. doi: 10.1016/j.jim.2012.05.011. Epub 2012 May 22. J Immunol Methods. 2012. PMID: 22626638 Free PMC article.
References
-
- Ansari, A. A., A. E. Mayne, J. B. Sundstrom, P. Bostik, B. Grimm, J. D. Altman, and F. Villinger. 2002. Administration of recombinant rhesus interleukin-12 during acute simian immunodeficiency virus (SIV) infection leads to decreased viral loads associated with prolonged survival in SIVmac251-infected rhesus macaques. J. Virol. 761731-1743. - PMC - PubMed
-
- Barcellini, W., G. P. Rizzardi, G. Poli, G. Tambussi, C. Velati, P. L. Meroni, A. G. Dalgleish, and A. Lazzarin. 1996. Cytokines and soluble receptor changes in the transition from primary to early chronic HIV type 1 infection. AIDS Res. Hum. Retrovir. 12325-331. - PubMed
-
- Beignon, A. S., K. McKenna, M. Skoberne, O. Manches, I. DaSilva, D. G. Kavanagh, M. Larsson, R. F. Gorelick, J. D. Lifson, and N. Bhardwaj. 2005. Endocytosis of HIV-1 activates plasmacytoid dendritic cells via Toll-like receptor-viral RNA interactions. J. Clin. Investig. 1153265-3275. - PMC - PubMed
-
- Biglino, A., A. Sinicco, B. Forno, A. M. Pollono, M. Sciandra, C. Martini, P. Pich, and P. Gioannini. 1996. Serum cytokine profiles in acute primary HIV-1 infection and in infectious mononucleosis. Clin. Immunol. Immunopathol. 7861-69. - PubMed
Publication types
MeSH terms
Substances
Grants and funding
LinkOut - more resources
Full Text Sources
Other Literature Sources
Research Materials
Miscellaneous
