. 2008 Sep;15(9):902-9.
doi: 10.1038/nsmb.1475.

Primary microRNA transcripts are processed co-transcriptionally

Affiliations

Primary microRNA transcripts are processed co-transcriptionally

Mariangela Morlando et al. Nat Struct Mol Biol. 2008 Sep.

Abstract

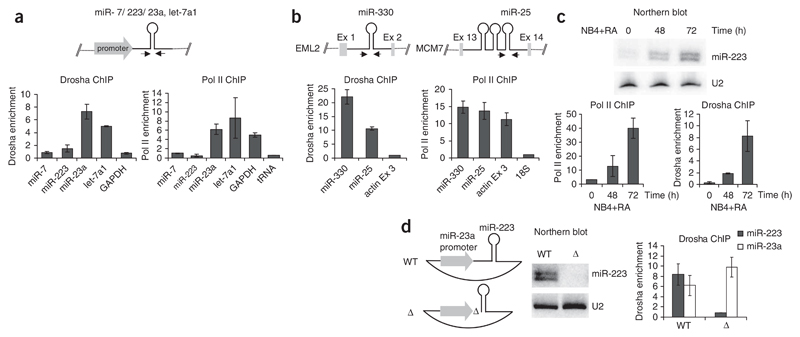
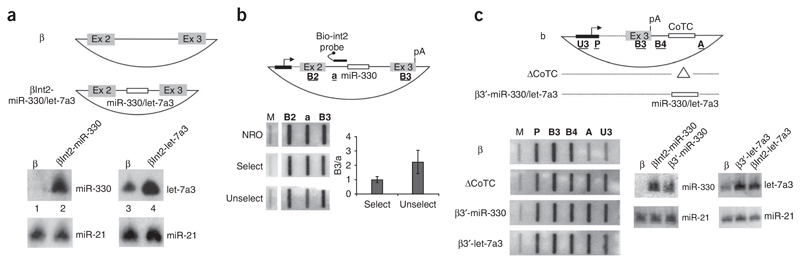
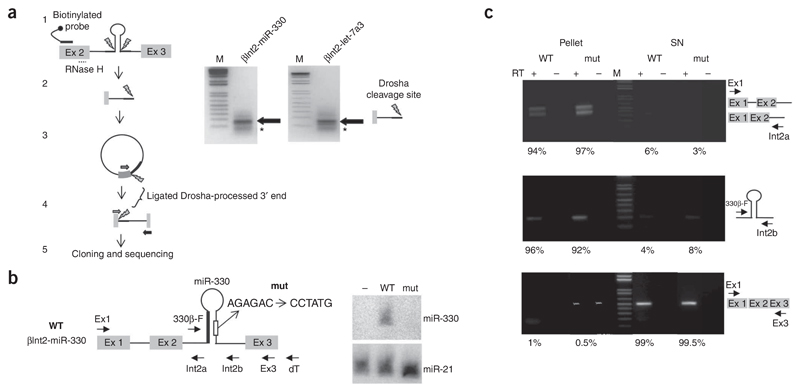
microRNAs (miRNAs) are generated from long primary (pri-) RNA polymerase II (Pol II)-derived transcripts by two RNase III processing reactions: Drosha cleavage of nuclear pri-miRNAs and Dicer cleavage of cytoplasmic pre-miRNAs. Here we show that Drosha cleavage occurs during transcription acting on both independently transcribed and intron-encoded miRNAs. We also show that both 5'-3' and 3'-5' exonucleases associate with the sites where co-transcriptional Drosha cleavage occurs, promoting intron degradation before splicing. We finally demonstrate that miRNAs can also derive from 3' flanking transcripts of Pol II genes. Our results demonstrate that multiple miRNA-containing transcripts are co-transcriptionally cleaved during their synthesis and suggest that exonucleolytic degradation from Drosha cleavage sites in pre-mRNAs may influence the splicing and maturation of numerous mRNAs.


Figures

Figure 1
Figure 1. Chromatin association of the Microprocessor complex.
(a) Association of Drosha and Pol II with miRNA gene chromatin in HeLa cells. The diagram depicts the miRNA gene (‘//’ denotes chromosomal integration), with ChIP analysis using either Drosha (left) or Pol II (right)–specific antibodies presented below. Results are based on quantitative real-time PCR analysis (Methods) using four different miRNA-specific probes and negative control probes for GAPDH and tRNA genes. Error bars show s.e.m. based on three independent experiments. (b) ChIP analysis of two endogenous intronic miR-330 and miR-25 miRNA sequences using Drosha and Pol II antibodies in HeLa cells. Maps of host EML2 and MCM7 genes are shown above the quantitative ChIP analysis. (c) Analysis of co-transcriptional recruitment of Drosha to the endogenous miR-223 gene following transcriptional activation by retinoic acid (RA) in NB4 cells. Northern blot analysis shows the progressive appearance of miR-223 following RA treatment. U2 snRNA was used as a positive control. This profile is consistent with increasing ChIP signals for Pol II and Drosha chromatin association. (d) miR-223 pcDNA plasmid constructs driven by the miR-23a promoter with (WT) or without (Δ) the 5′ single-stranded region of miR-223 (left) were transfected into HeLa cells, and total RNA was analyzed by northern blot (middle) or chromatin by Drosha ChIP (right). U2 and miR-23a probes provide positive controls.
Figure 2
Figure 2. Specificity of the Drosha–miRNA chromatin interaction.
(a) Diagram of the EML2 gene indicating the positions of exons, introns and the miR-330 hairpin. Arrows demonstrate positions of the PCR primers used to determine the specificity of the Drosha ChIP signal. ChIP analysis below (as in Figure 1) shows the enrichment of the Drosha ChIP signal over intron 1, whereas Pol II signals are observed for all probed regions. (b) The miR-23a Drosha ChIP signal (probe B) which also shows RNase sensitivity compared to the promoter region (probe A). (c) miR-330 Drosha ChIP signal shows RNAse sensitivity (with or without RNAse) compared to the actin control. For both miR-23a and miR-330, the Pol II ChIP signals, in contrast to the Drosha ChIP signals, are unaffected by RNase treatment. (d) Drosha ChIP analysis on endogenous miR-330 and miR-23a using HeLa cells depleted for DGCR8 by RNAi. Histograms show ChIP results based on quantitative real-time PCR analysis and demonstrate that Drosha recruitment is DGCR8 dependent.
Figure 3
Figure 3. miRNA maturation from the second intron and 3′ flanking region of the β-globin gene in HeLa cells.
(a) Diagram of the β-globin construct with or without insertion of either miR-330 or let-7a3 pre-miRNAs in intron 2 (βInt2-miR-330 or βInt2-let-7a3 constructs). The exons (gray boxes), introns (lines) and miRNAs (white box). Below, northern blot analysis of cytoplasmic RNA from transfected HeLa cells. Specific antisense oligonucleotides were used to detect miR-330, let-7a3 and miR-21 miRNAs. Lower northern blots detect endogenous miR-21, used as a loading control. (b) Diagram of βInt2-miR-330 showing positions of the NRO probes (underlined). ‘M’ denotes background signal. The HIV-1 promoter with the 5′ portion of the β-globin gene as a dashed line and the backbone plasmid are indicated as is the position of a biotinylated probe (Bio-int2). Graph shows the ratio between B3 and a hybridization signal (left) from selected and unselected fractions. (c) β-globin gene constructs with 3′ flanking CoTC and miRNA sequences shown as white boxes and CoTC deletion indicated by a white triangle. NRO probe positions are underlined. Left, NRO analysis of HeLa cells transiently transfected with constructs indicated. Whereas the β construct shows dramatic Pol II termination after probe B4, ΔCoTC and β3′-miR-330 and β3′-let-7a3 demonstrate read-through signals around the transfected plasmids, as detected by high signals over probes A and U3. Right, northern blot analysis of miRNAs produced from the indicated plasmid constructs, indicating that 3′ flanking and intronically located pre-miRNAs are expressed at similar levels.
Figure 4
Figure 4. Co-transcriptional processing of pre-miRNAs from the β-globin gene intron 2.
(a) hscRACE procedure, A diagram of β-globin transcript containing the pre-miRNA in intron 2 is shown (1). Grey boxes are exons whereas miRNA sequence is indicated by a hairpin within intron 2 (solid line). Drosha cleavage sites are shown as lightening bolts. Hybrid selection of this transcript was carried out using antisense biotinylated RNA (black line and circle) and selected transcripts were released by RNase H digestion directed by antisense DNA oligonucleotide (dotted line). Released RNAs were circularized by RNA ligation and reverse transcribed with a primer (arrow) across the ligation junction (2,3). PCR amplification using a primer pair (gray and black arrows) amplifies only cDNA obtained from the ligated RNA (4). Products were analyzed on agarose gel, cloned and sequenced (5). Right, agarose gel analysis of hscRACE products obtained from βInt2-miR-330 and βInt2-miR-let7a3 constructs. Major products are indicated by arrows and minor products by an asterisk. M indicates the molecular weight DNA marker. (b) Diagram of chimeric βInt2-miR-330 transcript with labeled arrows indicating the primers used for RT-PCR analysis. Hairpin sequences depict the miR-330 stem-loop with the mature miRNA position sequence as a thick line and the mutant sequence change as indicated. Right, northern blot analysis of miRNAs produced from the wild-type and mut plasmid constructs. Below, an endogenous miR-21 control. (c) RT-PCR analysis of the chromatin-associated (Pellet) and nucleoplasmic (SN) fractions carried out with the primer pairs indicated to the right of the agarose gels. Identities of the PCR products are shown to the right. Quantitative analysis was carried out by real-time PCR, as shown below as % RNA in Pellet or SN fractions.
Figure 5
Figure 5. Exonuclease activities are associated with chromatin of intronic pre-miRNAs.
(a) Schematic representation of two miRNA-hosting genes EML2 and MCM7, demonstrating positions of pre-miRNAs (hairpins) and PCR primer locations. (b) Real-time ChIP analysis using XRN2 and PMscl100 antibodies with the indicated PCR primers. (c) Diagram shows the position of exons (gray boxes), introns (solid lines) and primers (arrows) used to detect unspliced and spliced transcripts of the MCM7 and CTDSPL genes. Graphs show results from quantitative real-time RT-PCR analysis performed on total RNA extracted from HeLa cells treated with siRNAs targeting XRN2, PMscl100 and Drosha mRNAs. (d) Genomic location of miRNAs relative to their hosting genes. miRNAs in introns and exons are separated according to the nature of the hosting gene (protein-coding versus noncoding (nc) ESTs). miRNAs in alternatively spliced transcripts (Protein coding—between shuffled exons) as well as the intergenic regions are also presented in the table.

Similar articles

Cited by

References

    1. Kim VN. MicroRNA biogenesis: coordinated cropping and dicing. Nat Rev Mol Cell Biol. 2005;6:376–385. - PubMed
    1. Basyuk E, Suavet F, Doglio A, Bordonné R, Bertrand E. Human let-7 stem-loop precursors harbour features of RNase III cleavage products. Nucleic Acids Res. 2003;31:6593–6597. - PMC - PubMed
    1. Denli AM, Tops BBJ, Plasterk RHA, Ketting RF, Hannon GJ. Processing of primary microRNAs by the microprocessor complex. Nature. 2004;432:231–235. - PubMed
    1. Gregory RI, et al. The Microprocessor complex mediates the genesis of microRNAs. Nature. 2004;432:235–240. - PubMed
    1. Han J, et al. Molecular basis for the recognition of primary microRNAs by the Drosha-DGCR8 complex. Cell. 2006;125:887–901. - PubMed

Publication types