. 2009 Jan 15;23(2):208-22.
doi: 10.1101/gad.1750709.

A general mechanism for transcription regulation by Oct1 and Oct4 in response to genotoxic and oxidative stress

Affiliations

A general mechanism for transcription regulation by Oct1 and Oct4 in response to genotoxic and oxidative stress

Jinsuk Kang et al. Genes Dev. .

Abstract

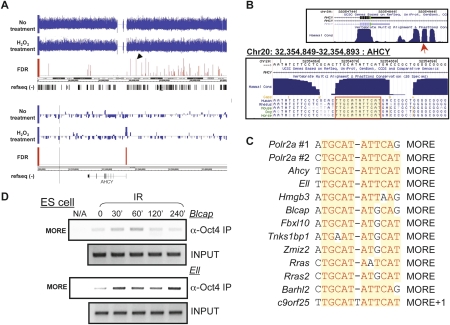
Oct1 and Oct4 are homologous transcription factors with similar DNA-binding specificities. Here we show that Oct1 is dynamically phosphorylated in vivo following exposure of cells to oxidative and genotoxic stress. We further show that stress regulates the selectivity of both proteins for specific DNA sequences. Mutation of conserved phosphorylation target DNA-binding domain residues in Oct1, and Oct4 confirms their role in regulating binding selectivity. Using chromatin immunoprecipitation, we show that association of Oct4 and Oct1 with a distinct group of in vivo targets is inducible by stress, and that Oct1 is essential for a normal post-stress transcriptional response. Finally, using an unbiased Oct1 target screen we identify a large number of genes targeted by Oct1 specifically under conditions of stress, and show that several of these inducible Oct1 targets are also inducibly bound by Oct4 in embryonic stem cells following stress exposure.


Figures

Figure 1.
Figure 1.
Genotoxic and oxidative stress induce Oct1 phosphorylation and dimerization at complex sites. (A) Oct1 was purified from HeLa nuclear extracts using nanoparticles coupled to multimerized octamer or mutant sequences. HeLa cells were treated with IR or H2O2 and incubated for 1 h. The eluted proteins were resolved using SDS-PAGE and silver stained. (NT) No treatment; (HP) H2O2. (Arrow) Oct1 band. (B) Identified Oct1 serine and threonine phosphorylation events superimposed on a schematic of the Oct1 amino acid structure. DNA-binding domain modification events identified separately by the Gygi laboratory are also shown. (C) Oct1 Western blot showing protein levels in the input HeLa nuclear extracts. (D) EMSA using a simple octamer probe and extracts from C. Arrows indicate free probe (P), nonspecific band (NS), monomeric Oct1 (1), and Oct1 antibody supershifted band (*). (E) EMSA using radiolabeled simple octamer, PORE, and MORE probes. Arrows indicate monomeric (1) and dimeric (2) occupancy, and free probe (P).
Figure 2.
Figure 2.
An endogenous 2XMORE interacts with four Oct1 molecules in a cooperative stress-induced complex. (A) UCSC Genome Browser (http://genome.ucsc.edu) screenshots of the human Polr2a locus. (Top) The region upstream of the TSS and mammalian conservation. Arrow indicates position of the 2XMORE. (Bottom) Higher-resolution screenshot showing the nucleotide sequence. Boxed sequences contain the conserved MOREs. (B) EMSA using probes designed from the sequence in A. Arrows indicate monomeric (1), dimeric (2), and tetrameric (4) occupancy. (*) Antibody supershift. The free probe was run off the gel. (C) EMSA using probes containing point mutations in one or both MOREs. A simple octamer probe of the same length was used as a control for monomeric binding. Arrows indicate monomeric (1), dimeric (2), and tetrameric (4) occupancy. (NS) Nonspecific band. Probe sequences are shown at bottom. (D) Kinetic dissociation assay of Oct1:DNA complexes assembled using simple octamer, MORE or 2XMORE probes. The top panels show the cropped bands from the imaged gel mobility shift. The plot shows quantification of average band intensities from three experiments together with decay curves calculated using exponential regression. Half-lives were calculated from these curves.
Figure 3.
Figure 3.
Oct1 functionally regulates Polr2a. (A) Time-course ChIP assay of Polr2a using HeLa cells treated with H2O2. H2B and input DNA are shown as controls. (B) Similar time-course experiment using IR. Oct1 association with a simple octamer site in Gadd45a is additionally shown. (C) Reporter activity of a 2XMORE linked to the SV-40 promoter in a luciferase-based assay. Constructs were transfected into HeLa cells. Experiment was performed in triplicate. Error bars depict standard deviations. (D) Activity of the human Polr2a promoter fragment (−600 to +1 relative to the TSS) linked to luciferase. A 45-bp 2XMORE deletion was made in the context of the full sequence. Empty vector was used as a control. (E, left panel) Real-time RT–PCR using intron-spanning mouse Polr2a primers and either wild-type or Oct1-deficient MEFs. Message levels are shown following treatment with 2 mM H2O2 relative to wild-type fibroblasts under unstressed conditions on a log2 scale. (Right panel) Dose response experiment. Polr2a expression was measured 4 h following exposure to different H2O2 doses. (F) Western blot showing time course of Pol II large subunit expression in immortalized MEFs cells treated with H2O2. β-actin is shown as a loading control.
Figure 4.
Figure 4.
Oct1 S385 and S335 mutations modulate DNA selectivity. (A) Molecular models based on the crystal structure of the Oct1 POU domain dimer bound to MORE DNA (Remenyi et al. 2001). Phospho-Ser 385 and Lys 296 are modeled (red and blue arrows). Bottom image shows predicted Å distance. Images generated using PYMOL (http://www.pymol.org). (B) EMSA using nuclear extracts prepared from Oct1-deficient immortalized MEFs infected with retroviruses encoding wild-type, S385A, S385D, or S385K Oct1. Arrows indicate monomeric (1) and dimeric (2) occupancy, and free probe (P). (NS) Nonspecific. (C) MORE DNA-Oct1 dimer structure showing Ser 335 (red). Lys 435 is also shown. (D) EMSA using nuclear extracts prepared from Oct1-deficient immortalized MEFs infected with retroviruses containing either wild-type, S335A, S335D, or S335K Oct1 cDNAs and probes tagged with Cy5. Arrows indicate monomeric (1) and dimeric (2) occupancy, and free probe (P). The gel was scanned using a Typhoon Imaging system (Molecular Dynamics). (Below) Oct1 Western blot of the input extracts.
Figure 5.
Figure 5.
Oct4 complex site binding is IR-inducible. (A) Alignment of DNA-binding domain amino acid sequences of human Oct1, Oct2, and Oct4. Homologous amino acids are highlighted. Oct1 S335 and S385 and the homologous Oct2/Oct4 serines are boxed. (B) EMSA using nuclear extracts from Oct1-deficient MEFs infected with retroviruses encoding murine Oct4 or uninfected controls. (NS) Nonspecific; (ND) not determined. Probes: (Oct) Simple octamer; (MR) MORE. (Inset) Oct4 Western blot using input extracts. (C) (Top panels) Screenshots of mouse Bmp4 locus intronic region. The MORE is marked with an arrow. Mammalian conservation is also shown. (Below) Higher-resolution image showing the MORE sequence and conservation. (Bottom panel) ChIP assay using mouse ES cells treated with IR and a primer pair spanning the Bmp4 MORE. (D) Microarray output tracks along the human Taf12 locus. Log2 microarray intensities are shown for library oligonucleotides. IR-treated ES extracts were prepared at 0-, 1-, and 3-h time points. (E) (Top panels) Oct1 and Oct4 ChIP assays using mouse ES and human HeLa cells and genomic oligonucleotides encompassing the enriched Taf12 region. (Bottom panels) ChIP time course showing Oct4 and Oct1 association with the Taf12 site following IR exposure of mouse ES cells and HeLa cells.
Figure 6.
Figure 6.
ChIPseq identifies inducible Oct1 targets. (A) Screenshots showing ChIPseq hits covering human chromosome 20. Arrow indicates one significant hit. (Bottom panel) Higher-magnification image showing this hit upstream of Ahcy. (B) Screenshots of murine Ahcy promoter. Sequence conservation is shown. MORE is highlighted. (C) MORE motifs in Oct1 targets identified by ChIPseq. (D) Oct4 ChIP using primer pairs spanning the homologous mouse region of a subset of inducible human Oct1 targets identified by ChIPseq, together with mouse ES cells treated with IR. Input DNA is shown as a control.

Similar articles

Cited by

References

    1. Almeida R., Almeida J., Shoshkes M., Mendes N., Mesquita P., Silva E., Van Seuningen I., Reis C.A., Santos-Silva F., David L. OCT-1 is over-expressed in intestinal metaplasia and intestinal gastric carcinomas and binds to, but does not transactivate, CDX2 in gastric cells. J. Pathol. 2005;207:396–401. - PubMed
    1. Botquin V., Hess H., Fuhrmann G., Anastassiadis C., Gross M.K., Vriend G., Scholer H.R. New POU dimer configuration mediates antagonistic control of an osteopontin preimplantation enhancer by Oct-4 and Sox-2. Genes & Dev. 1998;12:2073–2090. - PMC - PubMed
    1. Boyd K.E., Farnham P.J. Coexamination of site-specific transcription factor binding and promoter activity in living cells. Mol. Cell. Biol. 1999;19:8393–8399. - PMC - PubMed
    1. Boyer L.A., Lee T.I., Cole M.F., Johnstone S.E., Levine S.S., Zucker J.P., Guenther M.G., Kumar R.M., Murray H.L., Jenner R.G., et al. Core transcriptional regulatory circuitry in human embryonic stem cells. Cell. 2005;122:947–956. - PMC - PubMed
    1. Chen Y., Currie R.W. Heat shock treatment suppresses angiotensin II-induced SP-1 and AP-1 and stimulates Oct-1 DNA-binding activity in heart. Inflamm. Res. 2005;54:338–343. - PubMed

Publication types

MeSH terms

Substances