

Elongation, proliferation & migration differentiate endothelial cell phenotypes and determine capillary sprouting
- PMID: 19171061
- PMCID: PMC2672076
- DOI: 10.1186/1752-0509-3-13
Elongation, proliferation & migration differentiate endothelial cell phenotypes and determine capillary sprouting
Abstract
Background: Angiogenesis, the growth of capillaries from preexisting blood vessels, has been extensively studied experimentally over the past thirty years. Molecular insights from these studies have lead to therapies for cancer, macular degeneration and ischemia. In parallel, mathematical models of angiogenesis have helped characterize a broader view of capillary network formation and have suggested new directions for experimental pursuit. We developed a computational model that bridges the gap between these two perspectives, and addresses a remaining question in angiogenic sprouting: how do the processes of endothelial cell elongation, migration and proliferation contribute to vessel formation?
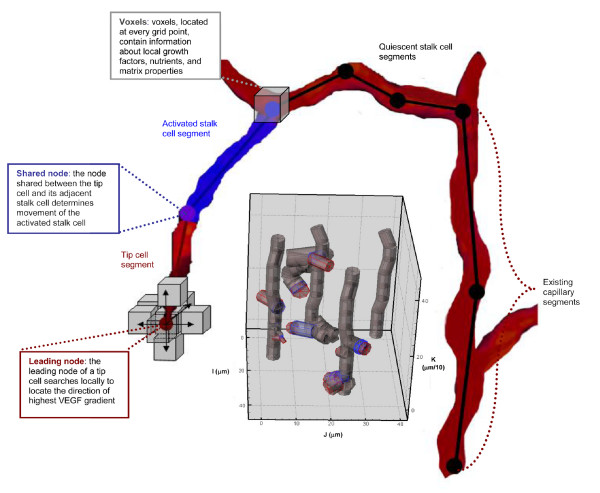
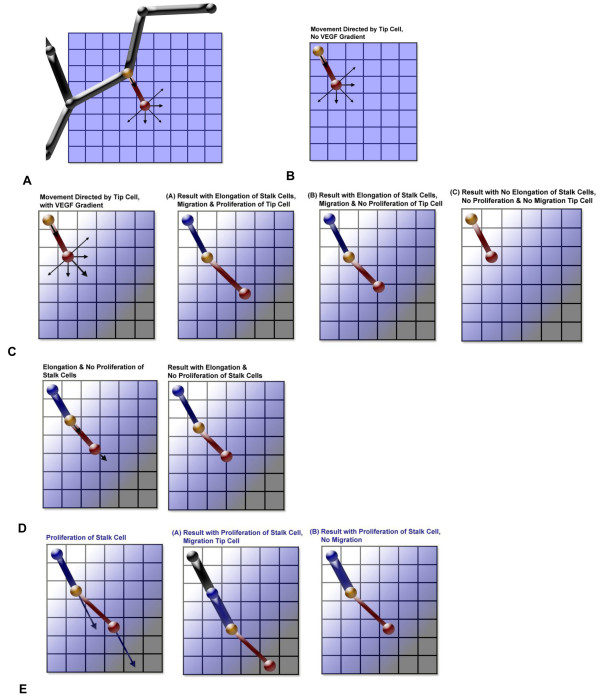
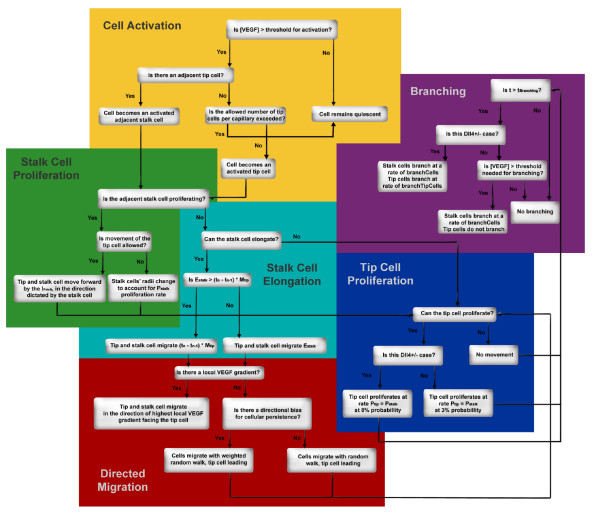
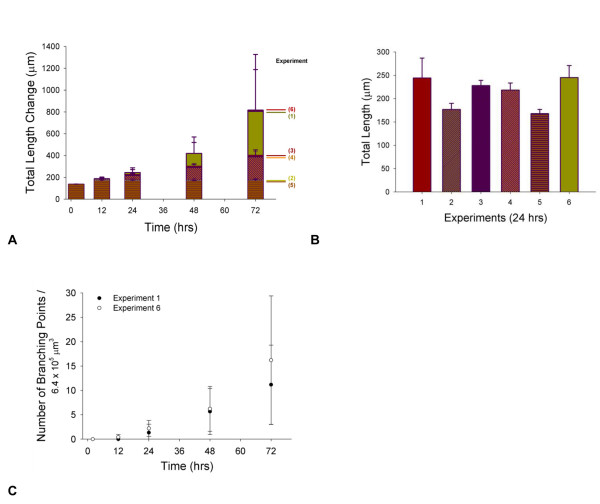
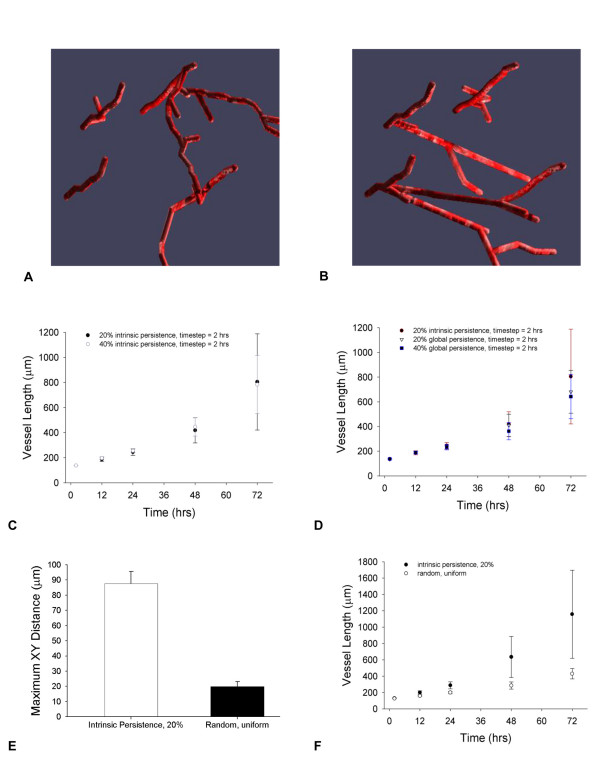
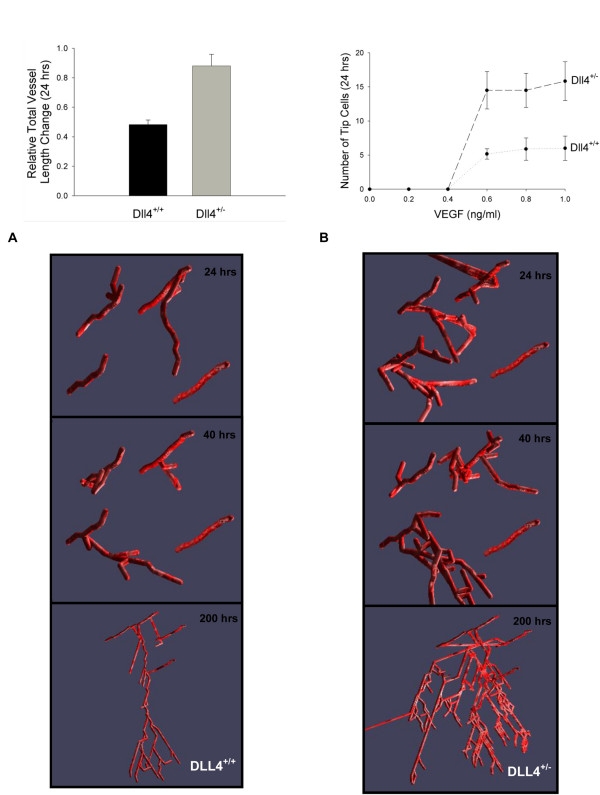
Results: We present a multiscale systems model that closely simulates the mechanisms underlying sprouting at the onset of angiogenesis. Designed by agent-based programming, the model uses logical rules to guide the behavior of individual endothelial cells and segments of cells. The activation, proliferation, and movement of these cells lead to capillary growth in three dimensions. By this means, a novel capillary network emerges out of combinatorially complex interactions of single cells. Rules and parameter ranges are based on literature data on endothelial cell behavior in vitro. The model is designed generally, and will subsequently be applied to represent species-specific, tissue-specific in vitro and in vivo conditions. Initial results predict tip cell activation, stalk cell development and sprout formation as a function of local vascular endothelial growth factor concentrations and the Delta-like 4 Notch ligand, as it might occur in a three-dimensional in vitro setting. Results demonstrate the differential effects of ligand concentrations, cell movement and proliferation on sprouting and directional persistence.
Conclusion: This systems biology model offers a paradigm closely related to biological phenomena and highlights previously unexplored interactions of cell elongation, migration and proliferation as a function of ligand concentration, giving insight into key cellular mechanisms driving angiogenesis.
Figures


Similar articles
-
Tip cell overtaking occurs as a side effect of sprouting in computational models of angiogenesis.BMC Syst Biol. 2015 Nov 21;9:86. doi: 10.1186/s12918-015-0230-7. BMC Syst Biol. 2015. PMID: 26589386 Free PMC article.
-
Computational Screening of Tip and Stalk Cell Behavior Proposes a Role for Apelin Signaling in Sprout Progression.PLoS One. 2016 Nov 9;11(11):e0159478. doi: 10.1371/journal.pone.0159478. eCollection 2016. PLoS One. 2016. PMID: 27828952 Free PMC article.
-
Dll4-containing exosomes induce capillary sprout retraction in a 3D microenvironment.Sci Rep. 2014 Feb 7;4:4031. doi: 10.1038/srep04031. Sci Rep. 2014. PMID: 24504253 Free PMC article.
-
Dynamics of endothelial cell behavior in sprouting angiogenesis.Curr Opin Cell Biol. 2010 Oct;22(5):617-25. doi: 10.1016/j.ceb.2010.08.010. Curr Opin Cell Biol. 2010. PMID: 20817428 Review.
-
Angiogenesis Revisited: An Overlooked Role of Endothelial Cell Metabolism in Vessel Sprouting.Microcirculation. 2015 Oct;22(7):509-17. doi: 10.1111/micc.12229. Microcirculation. 2015. PMID: 26250801 Review.
Cited by
-
Cellular mitosis predicts vessel stability in a mechanochemical model of sprouting angiogenesis.Biomech Model Mechanobiol. 2021 Jun;20(3):1195-1208. doi: 10.1007/s10237-021-01442-8. Epub 2021 Mar 14. Biomech Model Mechanobiol. 2021. PMID: 33715101 Free PMC article.
-
Integration of experimental and computational approaches to sprouting angiogenesis.Curr Opin Hematol. 2012 May;19(3):184-91. doi: 10.1097/MOH.0b013e3283523ea6. Curr Opin Hematol. 2012. PMID: 22406822 Free PMC article. Review.
-
Cancer systems biology: a network modeling perspective.Carcinogenesis. 2010 Jan;31(1):2-8. doi: 10.1093/carcin/bgp261. Epub 2009 Oct 27. Carcinogenesis. 2010. PMID: 19861649 Free PMC article. Review.
-
The Convergence of Cell-Based Surface Plasmon Resonance and Biomaterials: The Future of Quantifying Bio-molecular Interactions-A Review.Ann Biomed Eng. 2020 Jul;48(7):2078-2089. doi: 10.1007/s10439-019-02429-4. Epub 2019 Dec 6. Ann Biomed Eng. 2020. PMID: 31811474 Free PMC article. Review.
-
Formation of VEGF isoform-specific spatial distributions governing angiogenesis: computational analysis.BMC Syst Biol. 2011 May 2;5:59. doi: 10.1186/1752-0509-5-59. BMC Syst Biol. 2011. PMID: 21535871 Free PMC article.
References
-
- Semenza GL. Hydroxylation of HIF-1: oxygen sensing at the molecular level. Physiology (Bethesda) 2004;19:176–182. - PubMed
-
- Jiang BH, Semenza GL, Bauer C, Marti HH. Hypoxia-inducible factor 1 levels vary exponentially over a physiologically relevant range of O2 tension. Am J Physiol. 1996;271:C1172–1180. - PubMed
Publication types
MeSH terms
Substances
Grants and funding
LinkOut - more resources
Full Text Sources
Other Literature Sources
Miscellaneous
