Comparative Study
. 2009 Feb 16;206(2):399-410.
doi: 10.1084/jem.20082108. Epub 2009 Jan 19.

Host ER-parasitophorous vacuole interaction provides a route of entry for antigen cross-presentation in Toxoplasma gondii-infected dendritic cells

Affiliations
Comparative Study

Host ER-parasitophorous vacuole interaction provides a route of entry for antigen cross-presentation in Toxoplasma gondii-infected dendritic cells

Romina S Goldszmid et al. J Exp Med. .

Abstract

Toxoplasma gondii tachyzoites infect host cells by an active invasion process leading to the formation of a specialized compartment, the parasitophorous vacuole (PV). PVs resist fusion with host cell endosomes and lysosomes and are thus distinct from phagosomes. Because the parasite remains sequestered within the PV, it is unclear how T. gondii-derived antigens (Ag's) access the major histocompatibility complex (MHC) class I pathway for presentation to CD8(+) T cells. We demonstrate that recruitment of host endoplasmic reticulum (hER) to the PV in T. gondii-infected dendritic cells (DCs) directly correlates with cross-priming of CD8(+) T cells. Furthermore, we document by immunoelectron microscopy the transfer of hER components into the PV, a process indicative of direct fusion between the two compartments. In strong contrast, no association between hER and phagosomes or Ag presentation activity was observed in DCs containing phagocytosed live or dead parasites. Importantly, cross-presentation of parasite-derived Ag in actively infected cells was blocked when hER retrotranslocation was inhibited, indicating that the hER serves as a conduit for the transport of Ag between the PV and host cytosol. Collectively, these findings demonstrate that pathogen-driven hER-PV interaction can serve as an important mechanism for Ag entry into the MHC class I pathway and CD8(+) T cell cross-priming.


Figures

Figure 1
Figure 1
Only actively infected DCs cross-present T. gondii–derived Ag to CD8+ T cells. (A) CFSE-labeled naive OT-I CD8+ T cells were transferred into congenic recipients, which were subsequently challenged with either live, live irr, or noninfective killed (fix) TgOVA, TgOVA–infected MHC-I−/− DCs (MHC-I−/− inf), nontransgenic parasites (Tg), or PBS. Proliferation of OT-I cells was measured 3 d later in the draining lymph nodes. (B) Purified CD8+ T cells from infected C57BL/6 mice were restimulated with DCs exposed to live Tgirr or TgHK tachyzoites, or to soluble parasite extract (STAg), and IFN-γ production was measured by ELISA in 48-h supernatants. The values shown are the means ± SD of the ELISA readings from three mice per group. No cytokine production was detected when T cells were stimulated with DCs alone. (C and D) CFSE-labeled OT-I (C) or OT-II (D) cells were incubated with DCs preexposed to TgOVAirr, TgOVAHK, or Tg tachyzoites. (E and F) DCs were incubated with a mixture of TgHK and TgOVAirr tachyzoites (TgHK/TgOVAirr), Tgirr and TgOVAHK (Tgirr/TgOVAHK), or Tg alone, or were pulsed with SIINFEKL peptide (E) or ova-LB alone or mixed with either TgHK (TgHK/ova-LB) or Tgirr (Tgirr/ova-LB; F), and were cultured with CFSE-labeled OT-I T cells. In C–F, T cell proliferation was measured on day 3. The data shown in A–F are representative of at least three experiments. The numbers to the left of each histogram represent the percentage of cells showing reduced CFSE content as a measure of proliferation.
Figure 2
Figure 2
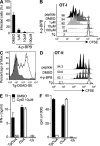
Blocking different steps of the invasion process inhibits cross-presentation. (A–D) TgOVA parasites were pretreated with 4-p-BPB or the DMSO vehicle alone and were incubated with DCs. (A) Effect of 4-p-BPB treatment on parasite invasion as determined by the percentage of infected cells. (B) Effect of parasite 4-p-BPB treatment on T cell activation. CFSE-labeled OT-I cells were incubated with the same DCs as described in A, DCs infected with Tg or DCs pulsed with SIINFEKL peptide. (C) DDAO-SE–labeled 4-p-BPB–treated tachyzoites were incubated with DCs at 37°C (open histogram) or 4°C (shaded histogram), and parasite uptake was assessed by flow cytometry at 2.5 h. The histograms shown are gated on CD11c+ cells. (D) CFSE-labeled OT-II cells were incubated with DCs preexposed to 100 µM 4-p-BPB or DMSO-treated TgOVA, Tg parasites, or were pulsed with peptide. In B and D, T cell proliferation was measured on day 3. The numbers to the left of each histogram represent the percentage of cells showing reduced CFSE content as a measure of proliferation. (E and F) DCs were incubated with Tg or TgOVA parasites in the presence or absence of CytD for 30 min, washed, and incubated for an additional 3.5 h before fixation. Microscopic examination revealed that CytD treatment completely inhibited cell invasion (not depicted). In another set of samples, CytD-pretreated or untreated DCs were incubated with 1 mg/ml of soluble OVA for the same time period and fixed. OT-I T cells were then added to the DC cultures, and IFN-γ production (E) and thymidine incorporation (F) were measured at 48 and 72 h, respectively. The values shown are means ± SD of triplicate cultures. The data presented in A–F are representative of three experiments performed. ND, not detected.
Figure 3
Figure 3
Association and fusion of hER with PV containing live T. gondii but not with phagosomes containing HK tachyzoites. (A and B) Confocal microscopy of DCs incubated with live T. gondii tachyzoites and stained with a combination of anti-KDEL (green; A) or anti-Sec61 (green; B) and anti-GRA7 (a parasite-dense granule protein localized at the PVM; red). The cells were examined by confocal microscopy, and the images were deconvolved and colocalization analysis was performed (yellow). Multiple PVs can be seen within the cell, and arrowheads pinpoint specific areas of intense colocalization of KDEL (A) or Sec61 (B) with PVM-associated GRA7. (C and D) Immuno-EM performed on cryosections of DCs showing (C) a live parasite inside a PV where hER components are detected between the PVM and parasite PM (arrowheads) revealed by anti-KDEL antibodies, or (D) a DC that has phagocytosed a noninfective parasite and where no hER is evident surrounding the parasite-containing phagosome. The images shown are representative of at least three experiments performed. n, nucleus; P, parasite. Bars: (A and B) 5 µm; (C and D) 0.2 µm.
Figure 4
Figure 4
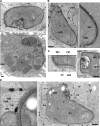
Localization of G6Pase activity in DCs infected with live T. gondii. (A–D) TEM of T. gondii–infected DCs. (A) Infected DCs showing dotted G6Pase activity staining around most of the PVs, indicating the presence of associated hER. The inset shows an example of a PV in which a more diffuse continuous staining is evident on the PVM and/or PV content. The asterisk designates PV lumen. (B–D) PV displaying strong G6Pase activity adjacent to the parasite PM in the vacuolar space. (B) The black arrow indicates an example of staining localized in the region between a host mitochondrion and the parasite suggestive of PV lumen localization. The white arrow in the inset illustrates the diffuse staining seen around the parasite that contrasts with the dotted staining of hER. (C and D) PV detail showing staining in the vacuolar space (C, inset) and associated with PVM facing the hER (D, inset). Parasite ER shows no labeling on all sections analyzed, confirming the absence of G6Pase homologue. The images shown are representative of at least 150 PVs examined. Go, Golgi; hm, host mitochondrion; IMC, inner membrane complex; m, mitochondrion; n, nucleus; P, parasite; pER, parasite ER. Bars, 0.5 µm.
Figure 5
Figure 5
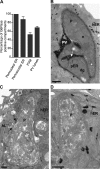
Quantification of G6Pase activity in infected DCs and absence of staining in DCs containing HK or opsonized T. gondii tachyzoites. (A) Quantification of G6Pase-positive compartments in a single EM plane in actively infected DCs. The data show the mean percentages ± SD of the compartments stained in each category for a total of 60 PVs examined. (B–D) TEM showing (B) a PV containing an irr parasite, and a phagosome containing (C) an antibody-opsonized or (D) an HK parasite. Note the absence of G6Pase staining in the phagosomal lumen (C and D) in contrast to the vacuolar space (B). Arrows in C show fusion of a host lysosome (hL) with the opsonized parasite-containing phagosome. dg, dense granule; n, nucleus; pER, parasite ER. Bars, 0.5 µm.
Figure 6
Figure 6
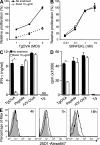
ExoA inhibits cross-presentation of T. gondii–derived Ag. (A and B) DCs were incubated with different MOIs of TgOVA parasites or increasing concentrations of SIINFEKL peptide in the presence or absence of ExoA and were fixed before co-culture with OT-I cells. T cell proliferation was measured at 72 h by thymidine incorporation. The values indicate the means ± SD of triplicate cultures. (C and D) DCs were incubated with TgOVA parasites (MOI = 4), SIINFEKL peptide, rVV-OVA, or Tg tachyzoites for 3.5 h in the presence or absence of ExoA and were fixed before co-culture with OT-I cells. (C) IFN-γ production and (D) thymidine incorporation were measured at 48 and 72 h, respectively. The values shown are means ± SD of triplicate cultures. Data pairs indicated by asterisks represent significant differences between conditions (P < 0.001). (E) DCs were incubated with TgOVA-YFP parasites in the presence or absence of ExoA. Expression of Kb–SIINFEKL complexes on the cell surface was assessed at different time points after infection by staining with the 25D1.16 mAb, followed by flow cytometry gating on CD11c+YFP+ (infected) or YFP (uninfected) cells. Shaded histograms indicate uninfected cells, continuous line histograms indicate infected cells without treatment, and dotted line histograms indicate infected cells treated with ExoA. Data shown in A–E are representative of at least three experiments. ND, not detected.
Figure 7
Figure 7
Proposed mechanism for cross-presentation of T. gondii–derived Ag. (left) Shown are events occurring after active invasion of DCs by live tachyzoites. (right) No cross-presentation is observed after phagocytic uptake of the parasites. Ag, T. gondii–derived Ag; ER, hER; ERAAP, ER aminopeptidase associated with Ag processing; L, lysosome; P, phagosome; Tg, T. gondii.

Similar articles

Cited by

References

    1. Mellman I., Steinman R.M. 2001. Dendritic cells: specialized and regulated antigen processing machines.Cell. 106:255–258 - PubMed
    1. Trombetta E.S., Mellman I. 2005. Cell biology of antigen processing in vitro and in vivo.Annu. Rev. Immunol. 23:975–1028 - PubMed
    1. Burgdorf S., Scholz C., Kautz A., Tampe R., Kurts C. 2008. Spatial and mechanistic separation of cross-presentation and endogenous antigen presentation.Nat. Immunol. 9:558–566 - PubMed
    1. Carruthers V.B., Sibley L.D. 1997. Sequential protein secretion from three distinct organelles of Toxoplasma gondii accompanies invasion of human fibroblasts.Eur. J. Cell Biol. 73:114–123 - PubMed
    1. Mordue D.G., Hakansson S., Niesman I., Sibley L.D. 1999. Toxoplasma gondii resides in a vacuole that avoids fusion with host cell endocytic and exocytic vesicular trafficking pathways.Exp. Parasitol. 92:87–99 - PubMed

Publication types

Substances