Loss of Tsc2 in radial glia models the brain pathology of tuberous sclerosis complex in the mouse
- PMID: 19150975
- PMCID: PMC2655769
- DOI: 10.1093/hmg/ddp025
Loss of Tsc2 in radial glia models the brain pathology of tuberous sclerosis complex in the mouse
Abstract
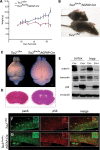
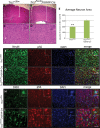
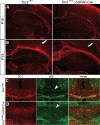
Tuberous sclerosis complex (TSC) is an autosomal dominant, tumor predisposition disorder characterized by significant neurodevelopmental brain lesions, such as tubers and subependymal nodules. The neuropathology of TSC is often associated with seizures and intellectual disability. To learn about the developmental perturbations that lead to these brain lesions, we created a mouse model that selectively deletes the Tsc2 gene from radial glial progenitor cells in the developing cerebral cortex and hippocampus. These Tsc2 mutant mice were severely runted, developed post-natal megalencephaly and died between 3 and 4 weeks of age. Analysis of brain pathology demonstrated cortical and hippocampal lamination defects, hippocampal heterotopias, enlarged dysplastic neurons and glia, abnormal myelination and an astrocytosis. These histologic abnormalities were accompanied by activation of the mTORC1 pathway as assessed by increased phosphorylated S6 in brain lysates and tissue sections. Developmental analysis demonstrated that loss of Tsc2 increased the subventricular Tbr2-positive basal cell progenitor pool at the expense of early born Tbr1-positive post-mitotic neurons. These results establish the novel concept that loss of function of Tsc2 in radial glial progenitors is one initiating event in the development of TSC brain lesions as well as underscore the importance of Tsc2 in the regulation of neural progenitor pools. Given the similarities between the mouse and the human TSC lesions, this model will be useful in further understanding TSC brain pathophysiology, testing potential therapies and identifying other genetic pathways that are altered in TSC.
Figures


Similar articles
-
A circuitry and biochemical basis for tuberous sclerosis symptoms: from epilepsy to neurocognitive deficits.Int J Dev Neurosci. 2013 Nov;31(7):667-78. doi: 10.1016/j.ijdevneu.2013.02.008. Epub 2013 Feb 26. Int J Dev Neurosci. 2013. PMID: 23485365 Free PMC article. Review.
-
Timing of mTOR activation affects tuberous sclerosis complex neuropathology in mouse models.Dis Model Mech. 2013 Sep;6(5):1185-97. doi: 10.1242/dmm.012096. Epub 2013 Jun 5. Dis Model Mech. 2013. PMID: 23744272 Free PMC article.
-
Complex Neurological Phenotype in Mutant Mice Lacking Tsc2 in Excitatory Neurons of the Developing Forebrain(123).eNeuro. 2015 Oct 22;2(6):ENEURO.0046-15.2015. doi: 10.1523/ENEURO.0046-15.2015. eCollection 2015 Nov-Dec. eNeuro. 2015. PMID: 26693177 Free PMC article.
-
Neuronal and glia abnormalities in Tsc1-deficient forebrain and partial rescue by rapamycin.Neurobiol Dis. 2012 Jan;45(1):369-80. doi: 10.1016/j.nbd.2011.08.024. Epub 2011 Aug 26. Neurobiol Dis. 2012. PMID: 21907282 Free PMC article.
-
Mourning Dr. Alfred G. Knudson: the two-hit hypothesis, tumor suppressor genes, and the tuberous sclerosis complex.Cancer Sci. 2017 Jan;108(1):5-11. doi: 10.1111/cas.13116. Epub 2017 Jan 23. Cancer Sci. 2017. PMID: 27862655 Free PMC article. Review.
Cited by
-
Metabolic remodeling precedes mTORC1-mediated cardiac hypertrophy.J Mol Cell Cardiol. 2021 Sep;158:115-127. doi: 10.1016/j.yjmcc.2021.05.016. Epub 2021 Jun 1. J Mol Cell Cardiol. 2021. PMID: 34081952 Free PMC article.
-
Graded loss of tuberin in an allelic series of brain models of TSC correlates with survival, and biochemical, histological and behavioral features.Hum Mol Genet. 2012 Oct 1;21(19):4286-300. doi: 10.1093/hmg/dds262. Epub 2012 Jun 29. Hum Mol Genet. 2012. PMID: 22752306 Free PMC article.
-
Current Review in Basic Science: Animal Models of Focal Cortical Dysplasia and Epilepsy.Epilepsy Curr. 2022 Apr 22;22(4):234-240. doi: 10.1177/15357597221098230. eCollection 2022 Jul-Aug. Epilepsy Curr. 2022. PMID: 36187145 Free PMC article. Review.
-
EphA4 Regulates the Balance between Self-Renewal and Differentiation of Radial Glial Cells and Intermediate Neuronal Precursors in Cooperation with FGF Signaling.PLoS One. 2015 May 15;10(5):e0126942. doi: 10.1371/journal.pone.0126942. eCollection 2015. PLoS One. 2015. PMID: 25978062 Free PMC article.
-
A circuitry and biochemical basis for tuberous sclerosis symptoms: from epilepsy to neurocognitive deficits.Int J Dev Neurosci. 2013 Nov;31(7):667-78. doi: 10.1016/j.ijdevneu.2013.02.008. Epub 2013 Feb 26. Int J Dev Neurosci. 2013. PMID: 23485365 Free PMC article. Review.
References
-
- Crino P.B., Nathanson K.L., Henske E.P. The tuberous sclerosis complex. N. Engl. J. Med. 2006;355:1345–1356. - PubMed
-
- Consortium. Identification and characterization of the tuberous sclerosis gene on chromosome 16. Cell. 1993;75:1305–1315. - PubMed
-
- van Slegtenhorst M., de Hoogt R., Hermans C., Nellist M., Janssen B., Verhoef S., Lindhout D., van den Ouweland A., Halley D., Young J., et al. Identification of the tuberous sclerosis gene TSC1 on chromosome 9q34. Science. 1997;277:805–808. - PubMed
-
- Cheadle J.P., Reeve M.P., Sampson J.R., Kwiatkowski D.J. Molecular genetic advances in tuberous sclerosis. Hum. Genet. 2000;107:97–114. - PubMed
-
- Chan J.A., Zhang H., Roberts P.S., Jozwiak S., Wieslawa G., Lewin-Kowalik J., Kotulska K., Kwiatkowski D.J. Pathogenesis of tuberous sclerosis subependymal giant cell astrocytomas: biallelic inactivation of TSC1 or TSC2 leads to mTOR activation. J. Neuropathol. Exp. Neurol. 2004;63:1236–1242. - PubMed
Publication types
MeSH terms
Substances
Grants and funding
LinkOut - more resources
Full Text Sources
Other Literature Sources
Medical
Molecular Biology Databases

