Detailed transcriptome atlas of the pancreatic beta cell
- PMID: 19146692
- PMCID: PMC2635377
- DOI: 10.1186/1755-8794-2-3
Detailed transcriptome atlas of the pancreatic beta cell
Abstract
Background: Gene expression patterns provide a detailed view of cellular functions. Comparison of profiles in disease vs normal conditions provides insights into the processes underlying disease progression. However, availability and integration of public gene expression datasets remains a major challenge. The aim of the present study was to explore the transcriptome of pancreatic islets and, based on this information, to prepare a comprehensive and open access inventory of insulin-producing beta cell gene expression, the Beta Cell Gene Atlas (BCGA).
Methods: We performed Massively Parallel Signature Sequencing (MPSS) analysis of human pancreatic islet samples and microarray analyses of purified rat beta cells, alpha cells and INS-1 cells, and compared the information with available array data in the literature.
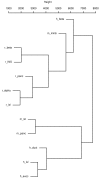
Results: MPSS analysis detected around 7600 mRNA transcripts, of which around a third were of low abundance. We identified 2000 and 1400 transcripts that are enriched/depleted in beta cells compared to alpha cells and INS-1 cells, respectively. Microarray analysis identified around 200 transcription factors that are differentially expressed in either beta or alpha cells. We reanalyzed publicly available gene expression data and integrated these results with the new data from this study to build the BCGA. The BCGA contains basal (untreated conditions) gene expression level estimates in beta cells as well as in different cell types in human, rat and mouse pancreas. Hierarchical clustering of expression profile estimates classify cell types based on species while beta cells were clustered together.
Conclusion: Our gene atlas is a valuable source for detailed information on the gene expression distribution in beta cells and pancreatic islets along with insulin producing cell lines. The BCGA tool, as well as the data and code used to generate the Atlas are available at the T1Dbase website (T1DBase.org).
Figures


Similar articles
-
T1DBase: integration and presentation of complex data for type 1 diabetes research.Nucleic Acids Res. 2007 Jan;35(Database issue):D742-6. doi: 10.1093/nar/gkl933. Epub 2006 Dec 14. Nucleic Acids Res. 2007. PMID: 17169983 Free PMC article.
-
Genome-wide profiling of histone H3K27 acetylation featured fatty acid signalling in pancreatic beta cells in diet-induced obesity in mice.Diabetologia. 2018 Dec;61(12):2608-2620. doi: 10.1007/s00125-018-4735-7. Epub 2018 Oct 3. Diabetologia. 2018. PMID: 30284014
-
Integration of ATAC-seq and RNA-seq identifies human alpha cell and beta cell signature genes.Mol Metab. 2016 Jan 11;5(3):233-244. doi: 10.1016/j.molmet.2016.01.002. eCollection 2016 Mar. Mol Metab. 2016. PMID: 26977395 Free PMC article.
-
Application of Affymetrix array and Massively Parallel Signature Sequencing for identification of genes involved in prostate cancer progression.BMC Cancer. 2005 Jul 22;5:86. doi: 10.1186/1471-2407-5-86. BMC Cancer. 2005. PMID: 16042785 Free PMC article.
-
Massively parallel signature sequencing (MPSS) as a tool for in-depth quantitative gene expression profiling in all organisms.Brief Funct Genomic Proteomic. 2002 Feb;1(1):95-104. doi: 10.1093/bfgp/1.1.95. Brief Funct Genomic Proteomic. 2002. PMID: 15251069 Review.
Cited by
-
Insulinoma-derived pseudo-islets for diabetes research.Am J Physiol Cell Physiol. 2021 Aug 1;321(2):C247-C256. doi: 10.1152/ajpcell.00466.2020. Epub 2021 Jun 9. Am J Physiol Cell Physiol. 2021. PMID: 34106785 Free PMC article.
-
Aldehyde dehydrogenase 1a3 defines a subset of failing pancreatic β cells in diabetic mice.Nat Commun. 2016 Aug 30;7:12631. doi: 10.1038/ncomms12631. Nat Commun. 2016. PMID: 27572106 Free PMC article.
-
Transcriptional Regulation of the Pancreatic Islet: Implications for Islet Function.Curr Diab Rep. 2015 Sep;15(9):66. doi: 10.1007/s11892-015-0635-0. Curr Diab Rep. 2015. PMID: 26272056 Free PMC article. Review.
-
In vivo beta-cell imaging with VMAT 2 ligands--current state-of-the-art and future perspective.Curr Pharm Des. 2010 May;16(14):1568-81. doi: 10.2174/138161210791164180. Curr Pharm Des. 2010. PMID: 20146666 Free PMC article. Review.
-
A genomic-based approach identifies FXYD domain containing ion transport regulator 2 (FXYD2)gammaa as a pancreatic beta cell-specific biomarker.Diabetologia. 2010 Jul;53(7):1372-83. doi: 10.1007/s00125-010-1714-z. Epub 2010 Apr 9. Diabetologia. 2010. PMID: 20379810
References
LinkOut - more resources
Full Text Sources
Other Literature Sources
Molecular Biology Databases

