

Continuous hypoxic culturing maintains activation of Notch and allows long-term propagation of human embryonic stem cells without spontaneous differentiation
- PMID: 19143764
- PMCID: PMC6496631
- DOI: 10.1111/j.1365-2184.2008.00571.x
Continuous hypoxic culturing maintains activation of Notch and allows long-term propagation of human embryonic stem cells without spontaneous differentiation
Abstract
Objective: The maintenance of pluripotency of human embryonic stem cells (hESCs) requires a high efficiency of self-renewal. During in vitro propagation, however, hESCs have a propensity to differentiate spontaneously. In this study, we assessed the nature of hESC responses to hypoxic conditions.
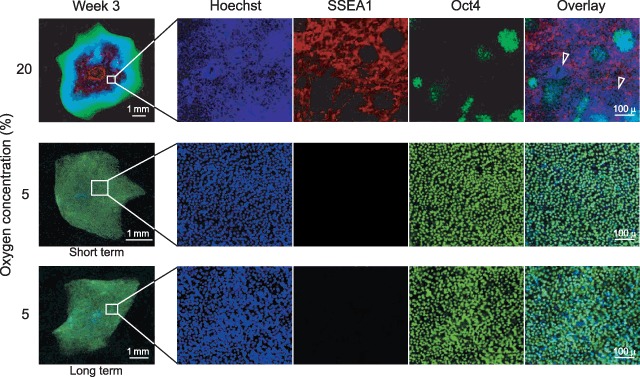
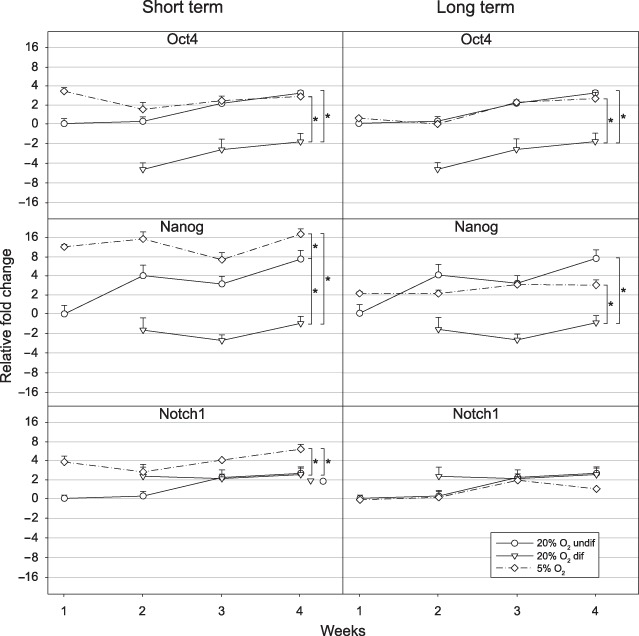
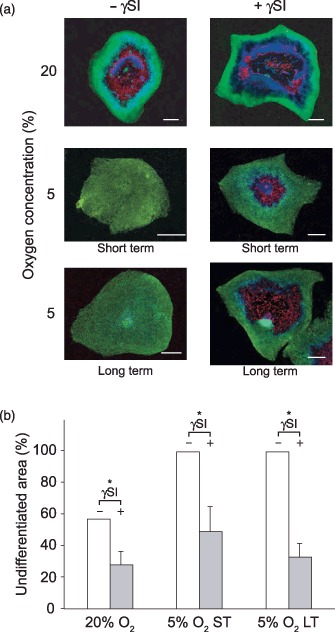
Materials and methods: Human embryonic stem cells were grown in normoxic and hypoxic conditions, and the cells expressing Oct4 and stage-specific embryonic antigen-1 were identified by indirect immunofluorescence. The transcriptional expression of Nanog, Notch1, and Oct4 was determined by a real-time reverse transcription-polymerase chain reaction, and the inhibition of Notch-mediated signalling was achieved with a gamma-secretase inhibitor.
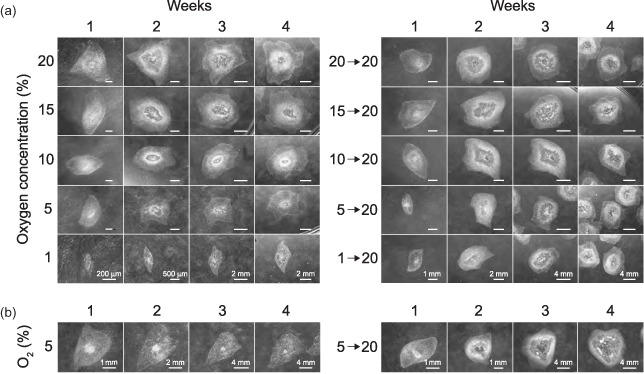
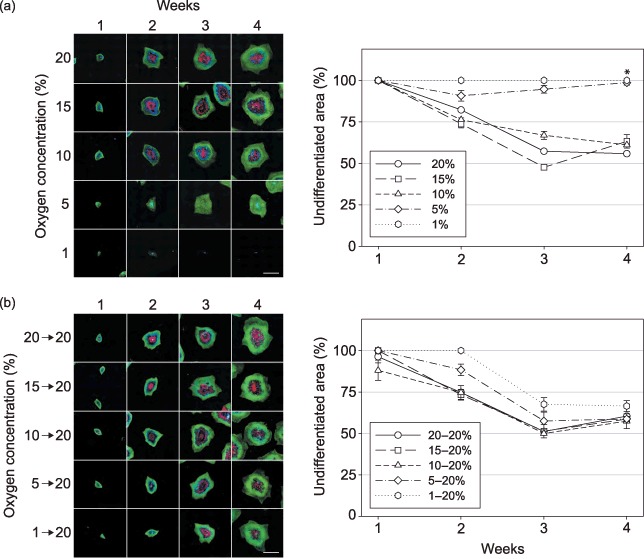
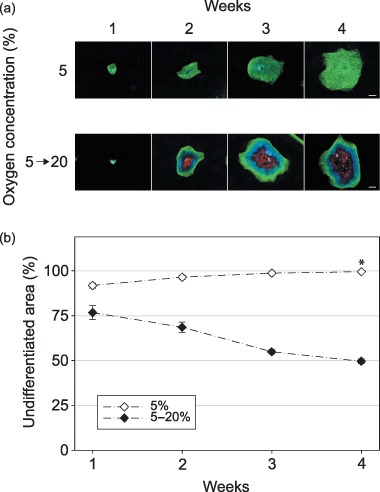
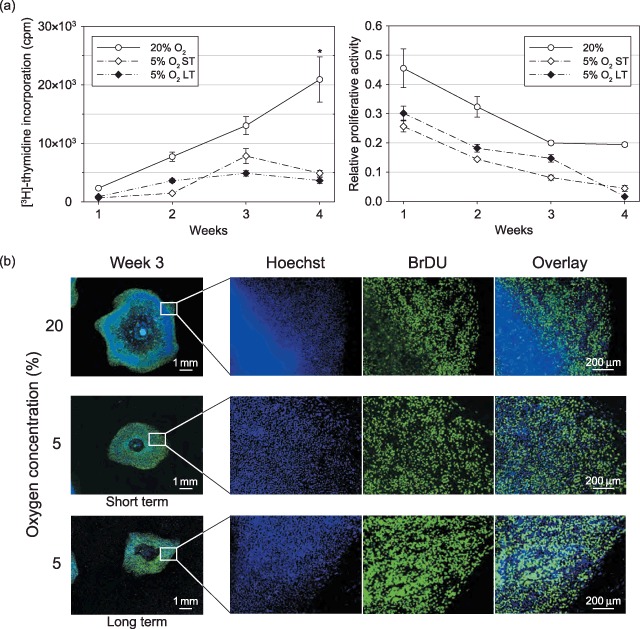
Results: In contrast to culture at 21% oxygen, where the colonies displayed a marked degree of differentiation, we found that during exposure to 5% oxygen, the hESC colonies displayed a homogenous and flat morphology that was consistent with the presence of Oct4-positive phenotype, indicating no spontaneous differentiation. When cultured at 5% oxygen for either 4 weeks or up to 18 months, high levels of Nanog and Notch1 transcriptional expression were detected, albeit the expression was significantly lower during longer exposure. The suppression of differentiation was rapidly reversed on transfer of the hypoxic cultures to normoxic conditions. Looking into the molecular mechanisms of the maintenance of self-renewal at low oxygen tensions, we found that inhibition of Notch signalling fully abrogated the hypoxic induction of undifferentiated phenotype.
Conclusion: Our data, thus, indicate that hypoxic exposure has the capacity to sustain long-term self-renewal of hESCs and that this effect is mediated through activation of Notch.
Figures
Similar articles
-
The effect of human embryonic stem cells (hESCs) long-term normoxic and hypoxic cultures on the maintenance of pluripotency.In Vitro Cell Dev Biol Anim. 2010 Apr;46(3-4):276-83. doi: 10.1007/s11626-010-9305-3. Epub 2010 Feb 23. In Vitro Cell Dev Biol Anim. 2010. PMID: 20177991
-
Notch and hedgehog signaling cooperate to maintain self-renewal of human embryonic stem cells exposed to low oxygen concentration.Int J Stem Cells. 2010 May;3(2):129-37. doi: 10.15283/ijsc.2010.3.2.129. Int J Stem Cells. 2010. PMID: 24855550 Free PMC article.
-
Continuous hypoxic culturing of human embryonic stem cells enhances SSEA-3 and MYC levels.PLoS One. 2013 Nov 13;8(11):e78847. doi: 10.1371/journal.pone.0078847. eCollection 2013. PLoS One. 2013. PMID: 24236059 Free PMC article.
-
Manipulation of OCT4 levels in human embryonic stem cells results in induction of differential cell types.Exp Biol Med (Maywood). 2007 Nov;232(10):1368-80. doi: 10.3181/0703-RM-63. Exp Biol Med (Maywood). 2007. PMID: 17959850
-
Self-renewal and differentiation capabilities are variable between human embryonic stem cell lines I3, I6 and BG01V.BMC Cell Biol. 2009 Jun 5;10:44. doi: 10.1186/1471-2121-10-44. BMC Cell Biol. 2009. PMID: 19500347 Free PMC article.
Cited by
-
Mathematical Modeling Reveals the Role of Hypoxia in the Promotion of Human Mesenchymal Stem Cell Long-Term Expansion.Stem Cells Int. 2018 May 14;2018:9283432. doi: 10.1155/2018/9283432. eCollection 2018. Stem Cells Int. 2018. PMID: 29861746 Free PMC article.
-
Acute severe hypoxia induces apoptosis of human pluripotent stem cells by a HIF-1α and P53 independent mechanism.Sci Rep. 2022 Nov 5;12(1):18803. doi: 10.1038/s41598-022-23650-7. Sci Rep. 2022. PMID: 36335243 Free PMC article.
-
Role of notch signaling in the maintenance of human mesenchymal stem cells under hypoxic conditions.Stem Cells Dev. 2014 Sep 15;23(18):2211-24. doi: 10.1089/scd.2013.0642. Epub 2014 Aug 5. Stem Cells Dev. 2014. PMID: 24878247 Free PMC article.
-
Long-Term Hypoxia Maintains a State of Dedifferentiation and Enhanced Stemness in Fetal Cardiovascular Progenitor Cells.Int J Mol Sci. 2021 Aug 29;22(17):9382. doi: 10.3390/ijms22179382. Int J Mol Sci. 2021. PMID: 34502291 Free PMC article.
-
Roles of reactive oxygen species in the fate of stem cells.Antioxid Redox Signal. 2014 Apr 20;20(12):1881-90. doi: 10.1089/ars.2012.4963. Epub 2012 Nov 19. Antioxid Redox Signal. 2014. PMID: 23066813 Free PMC article. Review.
References
-
- Giordano A, Galderisi U, Marino IR (2007) From the laboratory bench to the patient's bedside: an update on clinical trials with mesenchymal stem cells. J. Cell. Physiol. 211, 27–35. - PubMed
-
- Odorico JS, Kaufman DS, Thomson JA (2001) Multilineage differentiation from human embryonic stem cell lines. Stem Cells 19, 193–204. - PubMed
-
- Xu RH, Peck RM, Li DS, Feng X, Ludwig T, Thomson JA (2005) Basic FGF and suppression of BMP signaling sustain undifferentiated proliferation of human ES cells. Nat. Methods 2, 185–190. - PubMed
-
- Bigdeli N, Andersson M, Strehl R, Emanuelsson K, Kilmare E, Hyllner J et al (2007) Adaptation of human embryonic stem cells to feeder‐free and matrix‐free culture conditions directly on plastic surfaces. J. Biotechnol. 133, 146–153. - PubMed
Publication types
MeSH terms
Substances
Grants and funding
LinkOut - more resources
Full Text Sources
Research Materials
