

Function of mitochondrial Stat3 in cellular respiration
- PMID: 19131594
- PMCID: PMC2758306
- DOI: 10.1126/science.1164551
Function of mitochondrial Stat3 in cellular respiration
Abstract
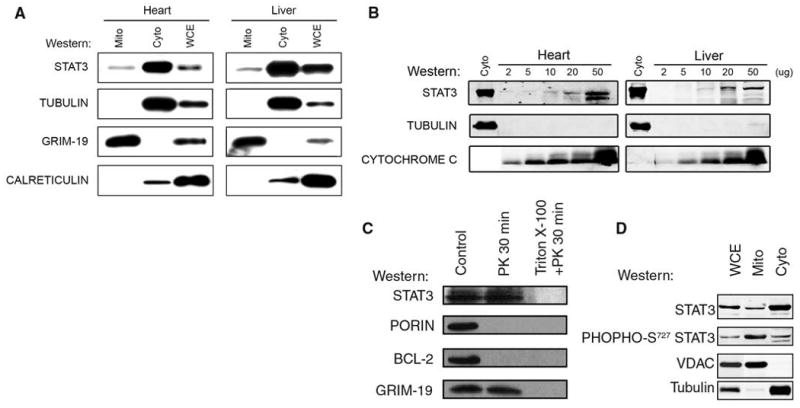
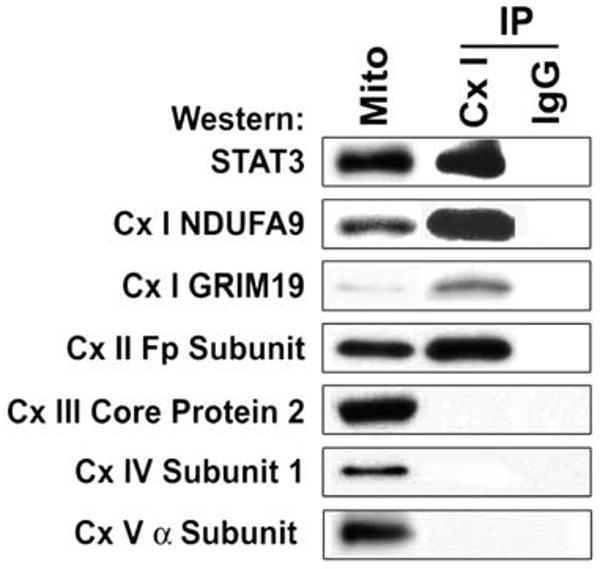
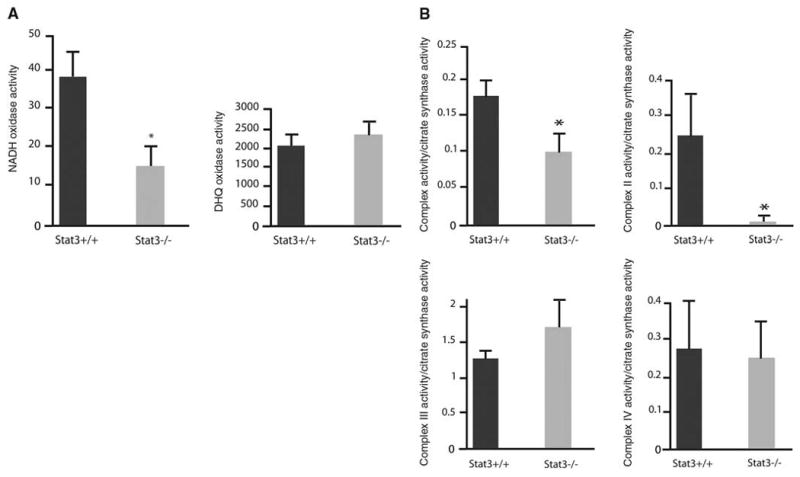
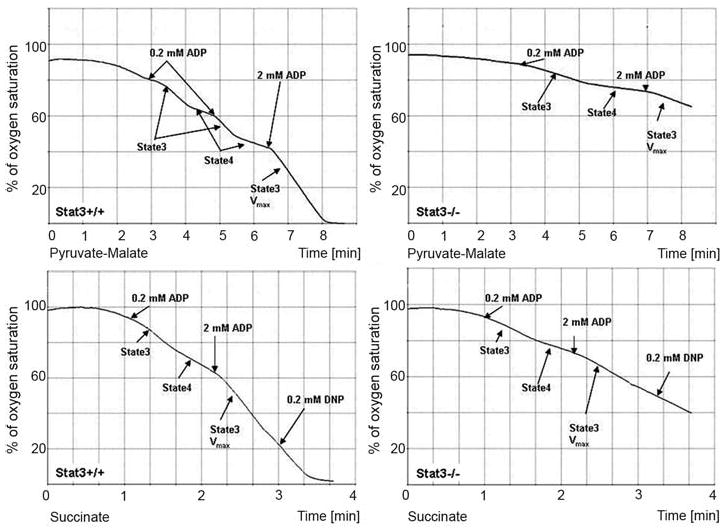
Cytokines such as interleukin-6 induce tyrosine and serine phosphorylation of Stat3 that results in activation of Stat3-responsive genes. We provide evidence that Stat3 is present in the mitochondria of cultured cells and primary tissues, including the liver and heart. In Stat3(-/-) cells, the activities of complexes I and II of the electron transport chain (ETC) were significantly decreased. We identified Stat3 mutants that selectively restored the protein's function as a transcription factor or its functions within the ETC. In mice that do not express Stat3 in the heart, there were also selective defects in the activities of complexes I and II of the ETC. These data indicate that Stat3 is required for optimal function of the ETC, which may allow it to orchestrate responses to cellular homeostasis.
Figures
Comment in
-
Cell biology. Moonlighting in mitochondria.Science. 2009 Feb 6;323(5915):723-4. doi: 10.1126/science.1169660. Science. 2009. PMID: 19197047 No abstract available.
Similar articles
-
Cell biology. Moonlighting in mitochondria.Science. 2009 Feb 6;323(5915):723-4. doi: 10.1126/science.1169660. Science. 2009. PMID: 19197047 No abstract available.
-
The import of the transcription factor STAT3 into mitochondria depends on GRIM-19, a component of the electron transport chain.J Biol Chem. 2013 Feb 15;288(7):4723-32. doi: 10.1074/jbc.M112.378984. Epub 2012 Dec 27. J Biol Chem. 2013. PMID: 23271731 Free PMC article.
-
Mitochondrial-targeted Signal transducer and activator of transcription 3 (STAT3) protects against ischemia-induced changes in the electron transport chain and the generation of reactive oxygen species.J Biol Chem. 2011 Aug 26;286(34):29610-20. doi: 10.1074/jbc.M111.226209. Epub 2011 Jun 29. J Biol Chem. 2011. PMID: 21715323 Free PMC article.
-
Cytoprotection by the modulation of mitochondrial electron transport chain: the emerging role of mitochondrial STAT3.Mitochondrion. 2012 Mar;12(2):180-9. doi: 10.1016/j.mito.2011.08.011. Epub 2011 Sep 10. Mitochondrion. 2012. PMID: 21930250 Free PMC article. Review.
-
The role of STAT3 in autophagy.Autophagy. 2015;11(5):729-39. doi: 10.1080/15548627.2015.1017192. Autophagy. 2015. PMID: 25951043 Free PMC article. Review.
Cited by
-
Inhibition of mammalian target of rapamycin protects against reperfusion injury in diabetic heart through STAT3 signaling.Basic Res Cardiol. 2015 May;110(3):31. doi: 10.1007/s00395-015-0486-5. Epub 2015 Apr 25. Basic Res Cardiol. 2015. PMID: 25911189 Free PMC article.
-
Janus kinase 2/signal transducer and activator of transcription 3 inhibitors attenuate the effect of cardiotrophin-like cytokine factor 1 and human focal segmental glomerulosclerosis serum on glomerular filtration barrier.Transl Res. 2015 Oct;166(4):384-98. doi: 10.1016/j.trsl.2015.03.002. Epub 2015 Mar 16. Transl Res. 2015. PMID: 25843671 Free PMC article.
-
Rational fusion design inspired by cell-penetrating peptide: SS31/S-14 G Humanin hybrid peptide with amplified multimodal efficacy and bio-permeability for the treatment of Alzheimer's disease.Asian J Pharm Sci. 2024 Aug;19(4):100938. doi: 10.1016/j.ajps.2024.100938. Epub 2024 Jun 24. Asian J Pharm Sci. 2024. PMID: 39253611 Free PMC article.
-
Effects of Noonan Syndrome-Germline Mutations on Mitochondria and Energy Metabolism.Cells. 2022 Oct 1;11(19):3099. doi: 10.3390/cells11193099. Cells. 2022. PMID: 36231062 Free PMC article. Review.
-
Oxidative stress and myocardial injury in the diabetic heart.J Pathol. 2013 Jan;229(2):232-41. doi: 10.1002/path.4113. J Pathol. 2013. PMID: 23011912 Free PMC article. Review.
References
Publication types
MeSH terms
Substances
Grants and funding
LinkOut - more resources
Full Text Sources
Other Literature Sources
Molecular Biology Databases
Miscellaneous
