Cyclical chromatin looping and transcription factor association on the regulatory regions of the p21 (CDKN1A) gene in response to 1alpha,25-dihydroxyvitamin D3
- PMID: 19122196
- PMCID: PMC2658101
- DOI: 10.1074/jbc.M808090200
Cyclical chromatin looping and transcription factor association on the regulatory regions of the p21 (CDKN1A) gene in response to 1alpha,25-dihydroxyvitamin D3
Abstract
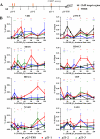
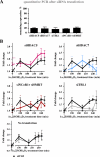
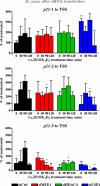
The nuclear receptor vitamin D receptor (VDR) is known to associate with three vitamin D response element (VDREs)-containing regions within the CDKN1A (p21) gene region. Here we show in MDA-MB453 breast cancer cells that the natural VDR ligand 1alpha,25-dihydroxyvitamin D(3) causes cyclical transcription factor binding and chromatin looping of distal VDREs to the transcription start site (TSS) of the p21 gene, leading to cyclical accumulation of the p21 mRNA. At the chromatin level, association of the mediator protein MED1 precedes both the peaks of VDR binding to VDREs and phosphorylated RNA polymerase (p-Pol II) to the TSS. The loss of co-repressor NCoR1-histone deacetylase (HDAC) 3 complex and inhibitory chromatin looping from VDREs to the TSS are also initial events followed by increased acetylation of histone 3 at lysine 9 at the TSS prior to initiation of transcription. Simultaneous to VDR and p-Pol II peaks, chromatin loops between VDREs and the TSS are formed, and the lysine demethylase LSD1 and the histone acetyltransferase CBP are enriched in both regions. This is followed by a moderate peak in p21 transcript accumulation, repeated in cycles of 45-60 min. The transcript accumulation pattern is disturbed by siRNA inhibition of the mediator protein MED1, LSD1, NCoR1, or various HDACs, whereas CBP appears unnecessary for the response. Inhibition of MED1, HDAC4, or LSD1 by siRNA also attenuates ligand-induced chromatin looping. In conclusion, 1alpha,25-dihydroxyvitamin D(3) regulates p21 transcription by inducing cyclical chromatin looping that depends on both histone deacetylation and demethylation.
Figures


Similar articles
-
Cyclical regulation of the insulin-like growth factor binding protein 3 gene in response to 1alpha,25-dihydroxyvitamin D3.Nucleic Acids Res. 2011 Jan;39(2):502-12. doi: 10.1093/nar/gkq820. Epub 2010 Sep 19. Nucleic Acids Res. 2011. PMID: 20855290 Free PMC article.
-
Distinct HDACs regulate the transcriptional response of human cyclin-dependent kinase inhibitor genes to Trichostatin A and 1alpha,25-dihydroxyvitamin D3.Nucleic Acids Res. 2008 Jan;36(1):121-32. doi: 10.1093/nar/gkm913. Epub 2007 Nov 13. Nucleic Acids Res. 2008. PMID: 17999998 Free PMC article.
-
Dynamics of 1α,25-dihydroxyvitamin D3-dependent chromatin accessibility of early vitamin D receptor target genes.Biochim Biophys Acta. 2013 Dec;1829(12):1266-75. doi: 10.1016/j.bbagrm.2013.10.003. Epub 2013 Nov 1. Biochim Biophys Acta. 2013. PMID: 24185200
-
The impact of chromatin organization of vitamin D target genes.Anticancer Res. 2006 Jul-Aug;26(4A):2637-45. Anticancer Res. 2006. PMID: 16886674 Review.
-
Vitamin D receptor-mediated suppression of RelB in antigen presenting cells: a paradigm for ligand-augmented negative transcriptional regulation.Arch Biochem Biophys. 2007 Apr 15;460(2):218-26. doi: 10.1016/j.abb.2007.01.034. Epub 2007 Feb 23. Arch Biochem Biophys. 2007. PMID: 17367745 Free PMC article. Review.
Cited by
-
3D shortcuts to gene regulation.Curr Opin Cell Biol. 2010 Jun;22(3):305-13. doi: 10.1016/j.ceb.2010.04.005. Epub 2010 May 11. Curr Opin Cell Biol. 2010. PMID: 20466532 Free PMC article. Review.
-
Dynamics of nuclear receptor target gene regulation.Chromosoma. 2010 Oct;119(5):479-84. doi: 10.1007/s00412-010-0283-8. Epub 2010 Jul 13. Chromosoma. 2010. PMID: 20625907 Free PMC article. Review.
-
Mediator-dependent nuclear receptor function.Semin Cell Dev Biol. 2011 Sep;22(7):749-58. doi: 10.1016/j.semcdb.2011.07.026. Epub 2011 Aug 10. Semin Cell Dev Biol. 2011. PMID: 21854863 Free PMC article. Review.
-
Dynamic estrogen receptor interactomes control estrogen-responsive trefoil Factor (TFF) locus cell-specific activities.Mol Cell Biol. 2014 Jul;34(13):2418-36. doi: 10.1128/MCB.00918-13. Epub 2014 Apr 21. Mol Cell Biol. 2014. PMID: 24752895 Free PMC article.
-
Vitamin D receptor and epigenetics in HIV infection and drug abuse.Front Microbiol. 2015 Aug 19;6:788. doi: 10.3389/fmicb.2015.00788. eCollection 2015. Front Microbiol. 2015. PMID: 26347716 Free PMC article. Review.
References
-
- Carlberg, C., and Polly, P. (1998) Crit. Rev. Eukaryot. Gene Expr. 8 19-42 - PubMed
-
- DeLuca, H. F. (2004) Am. J. Clin. Nutr. 80 1689S-1696S - PubMed
-
- Ingraham, B. A., Bragdon, B., and Nohe, A. (2008) Curr. Med. Res. Opin. 24 139-149 - PubMed
-
- Deeb, K. K., Trump, D. L., and Johnson, C. S. (2007) Nat. Rev. Cancer 7 684-700 - PubMed
-
- Liu, M., Lee, M.-H., Cohen, M., Bommakanti, M., and Freedman, L. P. (1996) Genes Dev. 10 142-153 - PubMed
Publication types
MeSH terms
Substances
LinkOut - more resources
Full Text Sources
Research Materials
Miscellaneous

